LOWSCREAMER™
Crypto enthusiast | Market analysis | Web3 Learning, researching, and sharing insights on the crypto market.
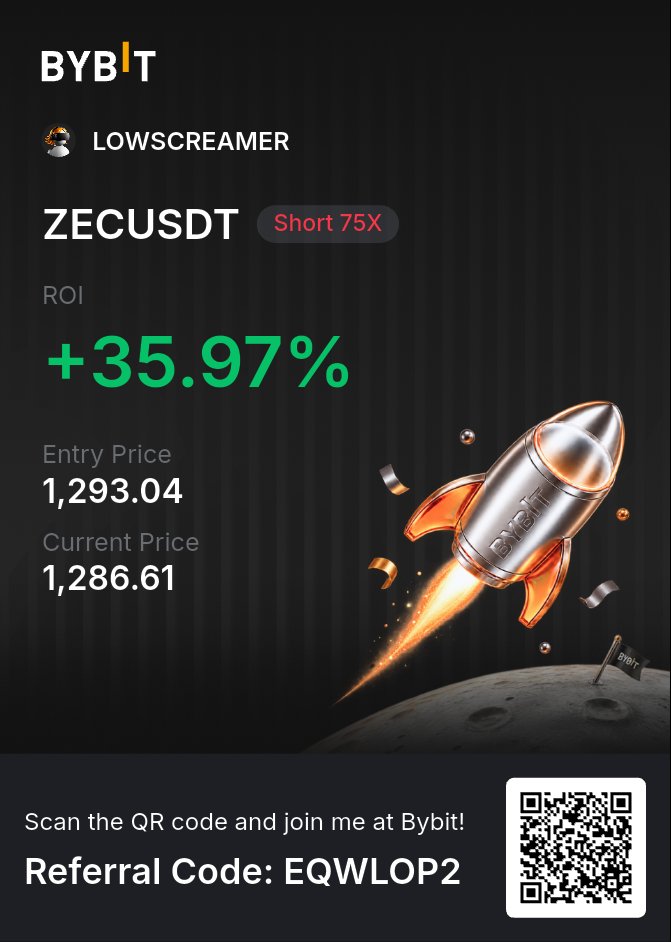
🔴 $ZECUSDT — 1H Chart Analysis
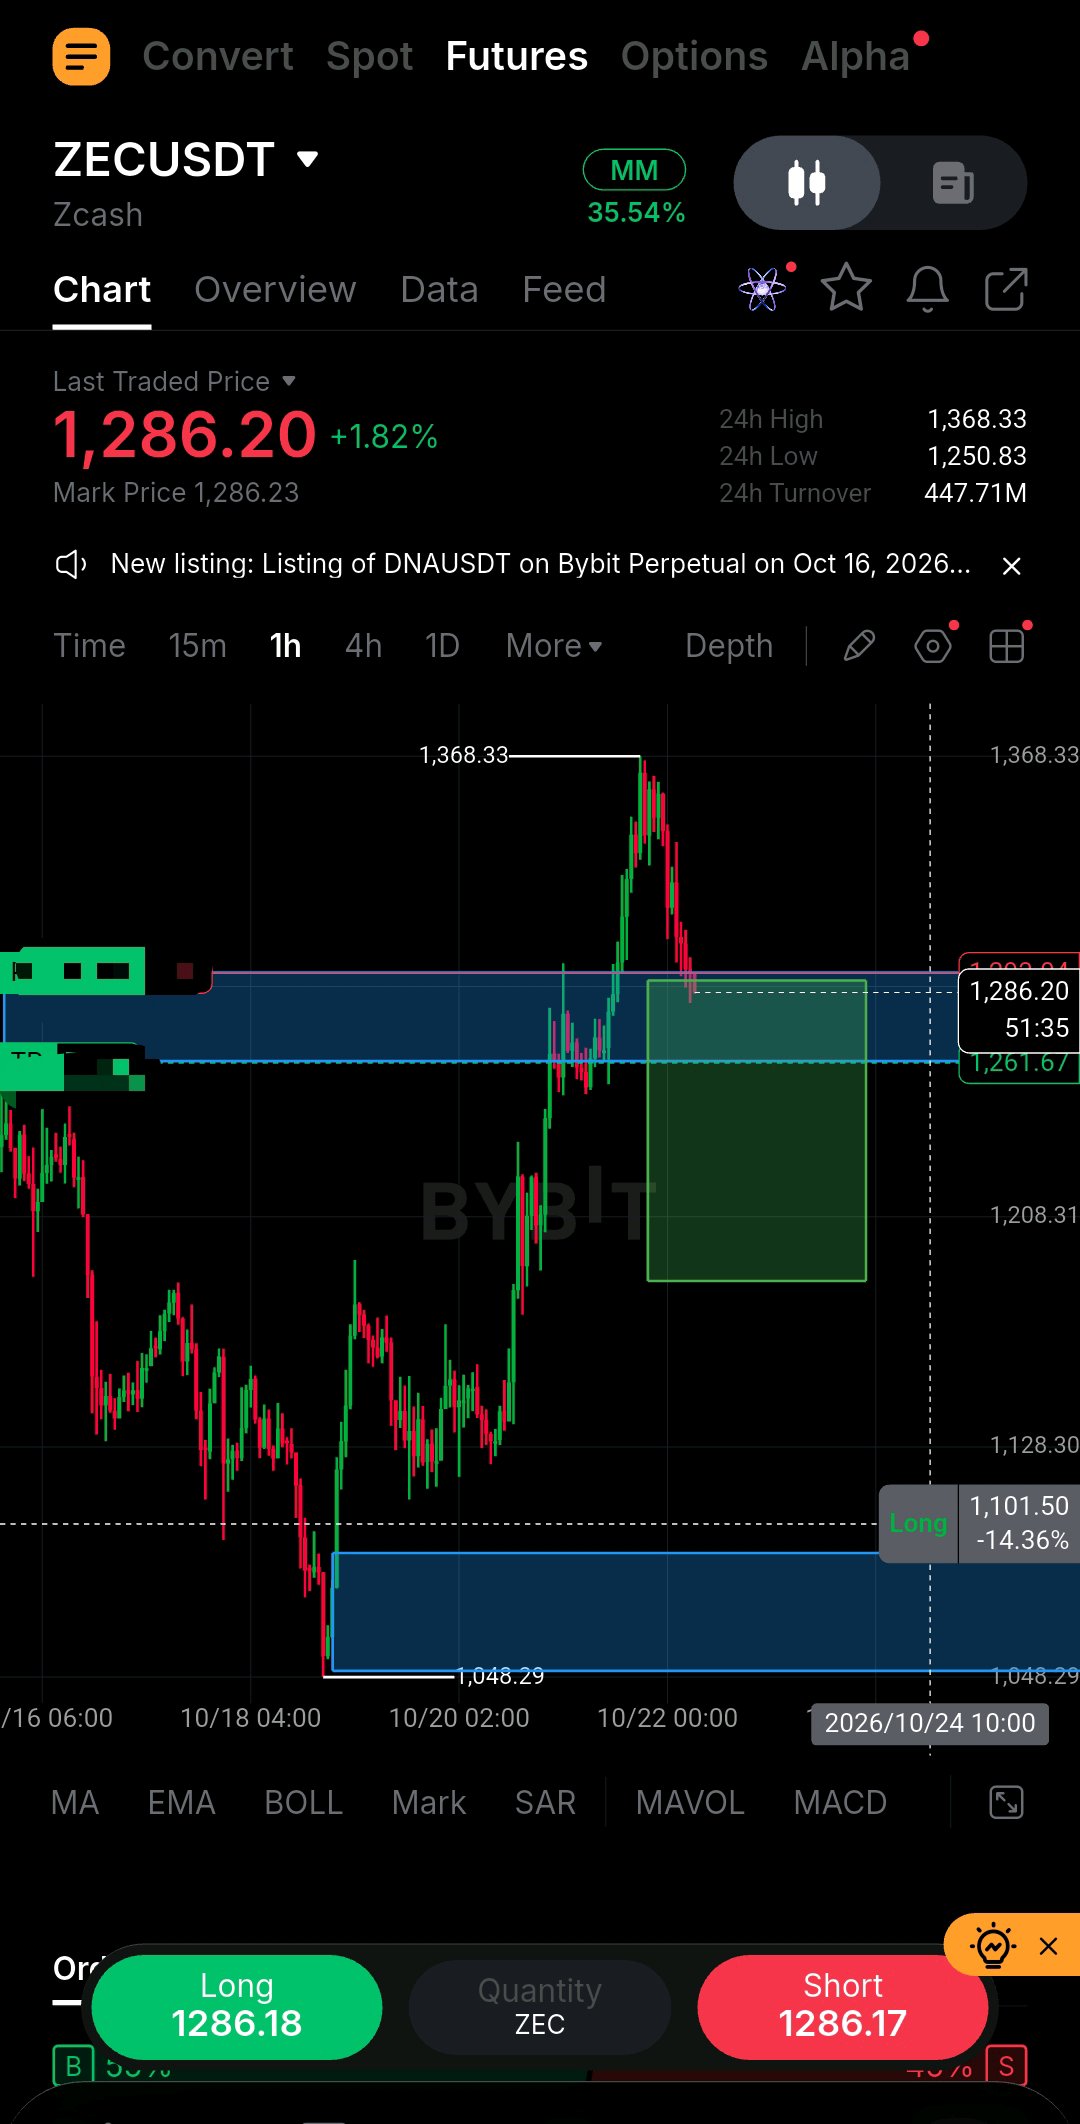
ZEC is facing strong resistance after a sharp rally. Will the price break higher or pull back? Current Price: $1,286.20 24H High: $1,368.33 24H Low: $1,250.83 📊 Technical Analysis ZEC surged from the $1,048 support zone to $1,368 before facing strong selling pressure. The price has now pulled back toward the $1,280–$1,290 area, which could determine its next move. 🟢 Bullish Scenario Support: $1,260–$1,270 First target: $1,320 Second target: $1,350 Major resistance: $1,368 If ZEC holds above $1,260 and reclaims $1,300, buyers could push the price toward $1,320–$1,350. A clean breakout above $1,368 would strengthen the bullish outlook. 🔴 Bearish Scenario Key support: $1,260 First target: $1,230 Second target: $1,208 Major support: $1,150–$1,100 If the price loses $1,260 and fails to recover, selling pressure could push ZEC toward $1,230 and potentially $1,208. 🎯 My Trading Bias Neutral to bearish in the short term until buyers reclaim $1,300. The sharp rejection from $1,368 suggests buyers are losing momentum, but the broader recovery remains relevant. I would watch how the price reacts around $1,260 before considering a position. A confirmed breakout or breakdown is more reliable than guessing the next move. Remember: These are potential scenarios, not guaranteed targets. Always manage risk and wait for confirmation. What do you think? Will ZEC reclaim $1,300 or drop toward $1,230 first? $ZETAUSDT $BTCUSDT #MyByXTake #ByXIMPACT #BybitStocks #USCPI #USNonfarmPayrolls
🔥 $TSLA vs $META: The AI Battle Is Heating Up!
Two tech giants. Two different strategies. One major question: Which company has the stronger growth story? Tesla ($TSLA) and Meta Platforms ($META) are attracting attention following their latest Q3 2026 earnings reports. Both companies are investing heavily in artificial intelligence, but their financial performance reveals two very different stories. 📊 1. TESLA ($TSLA): THE HIGH-RISK GROWTH STORY Tesla reported Q3 revenue of approximately $28.05 billion, while adjusted earnings reached $0.48 per share, beating analyst expectations. However, revenue fell short of forecasts, and net income declined 44% year over year to $787 million. Tesla's future investment thesis extends beyond electric vehicles. Investors are watching its progress in autonomous driving, robotaxis, robotics, and AI infrastructure. Bullish catalyst: Successful execution of its autonomous-driving and robotics ambitions could create additional growth opportunities. Key risk: Profitability, vehicle demand, competition, and the substantial investment required to develop new technologies. 📊 2. META ($META): THE DIGITAL ADVERTISING POWERHOUSE Meta reported Q3 revenue of $64.60 billion, representing 26% year-over-year growth. However, operating income declined 37% to $12.99 billion, partly because of a $9.89 billion legal charge. Excluding that charge, operating income would have been approximately $22.88 billion. Meta continues to invest heavily in AI to improve advertising performance, recommendations, and its family of applications. Bullish catalyst: Strong advertising growth and successful AI monetization could support future earnings. Key risk: Rising AI infrastructure costs, legal expenses, and uncertainty over how quickly new investments will generate returns. 📈 THE HEAD-TO-HEAD Revenue growth: META leads with 26% year-over-year growth. Profitability: META generated significantly more operating income, even after accounting for its legal charge. Future growth potential: Both companies have substantial opportunities, but Tesla's valuation depends heavily on expectations for businesses beyond traditional vehicle manufacturing. Business stability: Meta's established advertising business provides a different financial foundation from Tesla's more capital-intensive automotive and emerging technology operations. 🎯 MY VERDICT Meta currently has the stronger demonstrated financial performance, supported by rapid revenue growth and an established advertising business. Tesla offers a different growth proposition, with autonomous driving, robotics, and AI potentially creating substantial opportunities if execution matches expectations. But remember: A better company is not automatically a better-valued stock. The price investors pay, future earnings, and market expectations all matter. The real question is not simply which company has the bigger vision. It is which company can turn its investments into sustainable shareholder value. 🔥 Which has the stronger long-term story: $TSLA or $META? $TSLAXUSDT $METAXUSDT #MyByXTake #ByXIMPACT #BybitStocks #USCPI #TOKEN2049

Bulls Strike Back! Is $230 the Next Target?
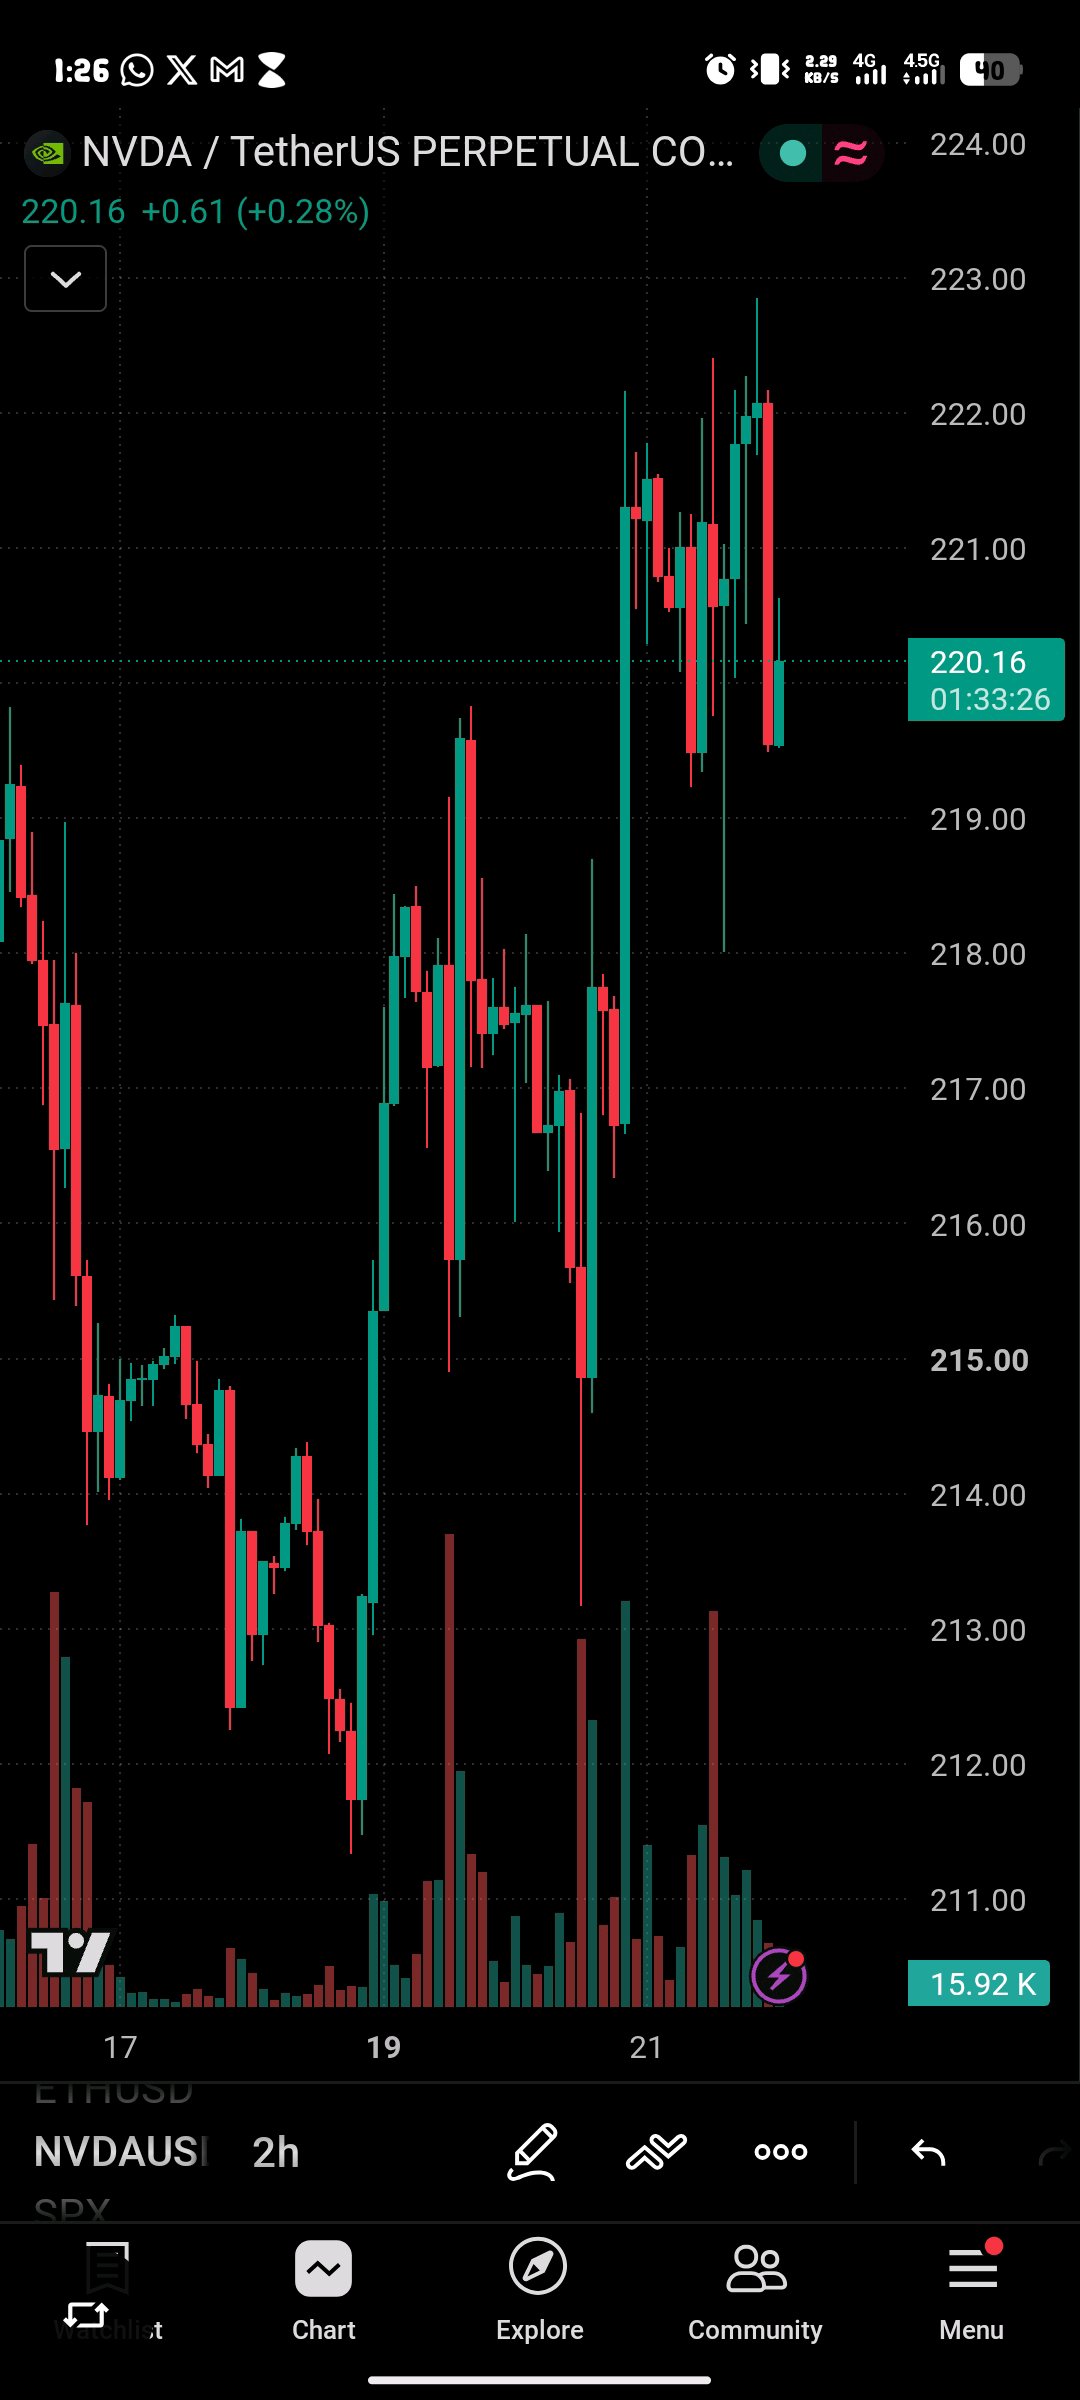
NVIDIA is showing signs of recovery after facing significant selling pressure over the past two weeks. With buyers stepping back into the market, the big question is whether this rebound can develop into a sustained breakout or simply become another temporary relief rally. The AI giant is approaching a critical turning point. 📊 MARKET STRUCTURE NVIDIA ($NVDA) closed at $216.47 on October 20 before rebounding approximately 2.4% to $221.74 on October 21. This recovery suggests that buyers are attempting to regain control after the recent correction. Fundamentally, NVIDIA remains at the center of the AI infrastructure boom. On October 15, the company announced new initiatives around its next-generation Vera Rubin platform, reinforcing its focus on AI computing and data-center infrastructure. However, strong fundamentals do not guarantee immediate price appreciation. Traders must still monitor resistance, volume, and broader technology-sector sentiment. 🔑 KEY LEVELS TO WATCH 🟢 Support zone: $217–$218 🟢 Major support: $212–$214 🔴 Immediate resistance: $222–$225 🎯 Bullish target 1: $230 🚀 Bullish target 2: $235–$240 🐂 BULLISH SCENARIO If NVDA holds above $217–$218 and breaks through $225 with strong buying volume, the recovery could extend toward $230. A sustained breakout above $230 could open the door toward $235–$240, provided momentum continues and the broader market remains supportive. The key confirmation is a successful breakout followed by a retest that holds as support. 🐻 BEARISH SCENARIO If NVIDIA fails to break $222–$225 and selling pressure returns, the stock could revisit $217. A decisive breakdown below $212 would weaken the recovery structure and potentially expose the stock to another downward move. Investors should also monitor AI-sector sentiment, capital-spending expectations, and developments affecting semiconductor demand. 🎯 MY MARKET VERDICT My short-term outlook is cautiously bullish above $217, but $225 remains the key breakout level. A convincing move above $225 could strengthen the recovery toward $230. Failure to hold support, however, would signal that sellers remain active. NVIDIA's long-term AI story remains important, but the next short-term move depends on price confirmation rather than headlines alone. Watch $225 closely. The next decisive move could determine whether NVDA's recovery has real strength. 🟢 $NVDAXUSDT : #MyByXTake #ByXIMPACT #BybitStocks #USCPI #TOKEN2049
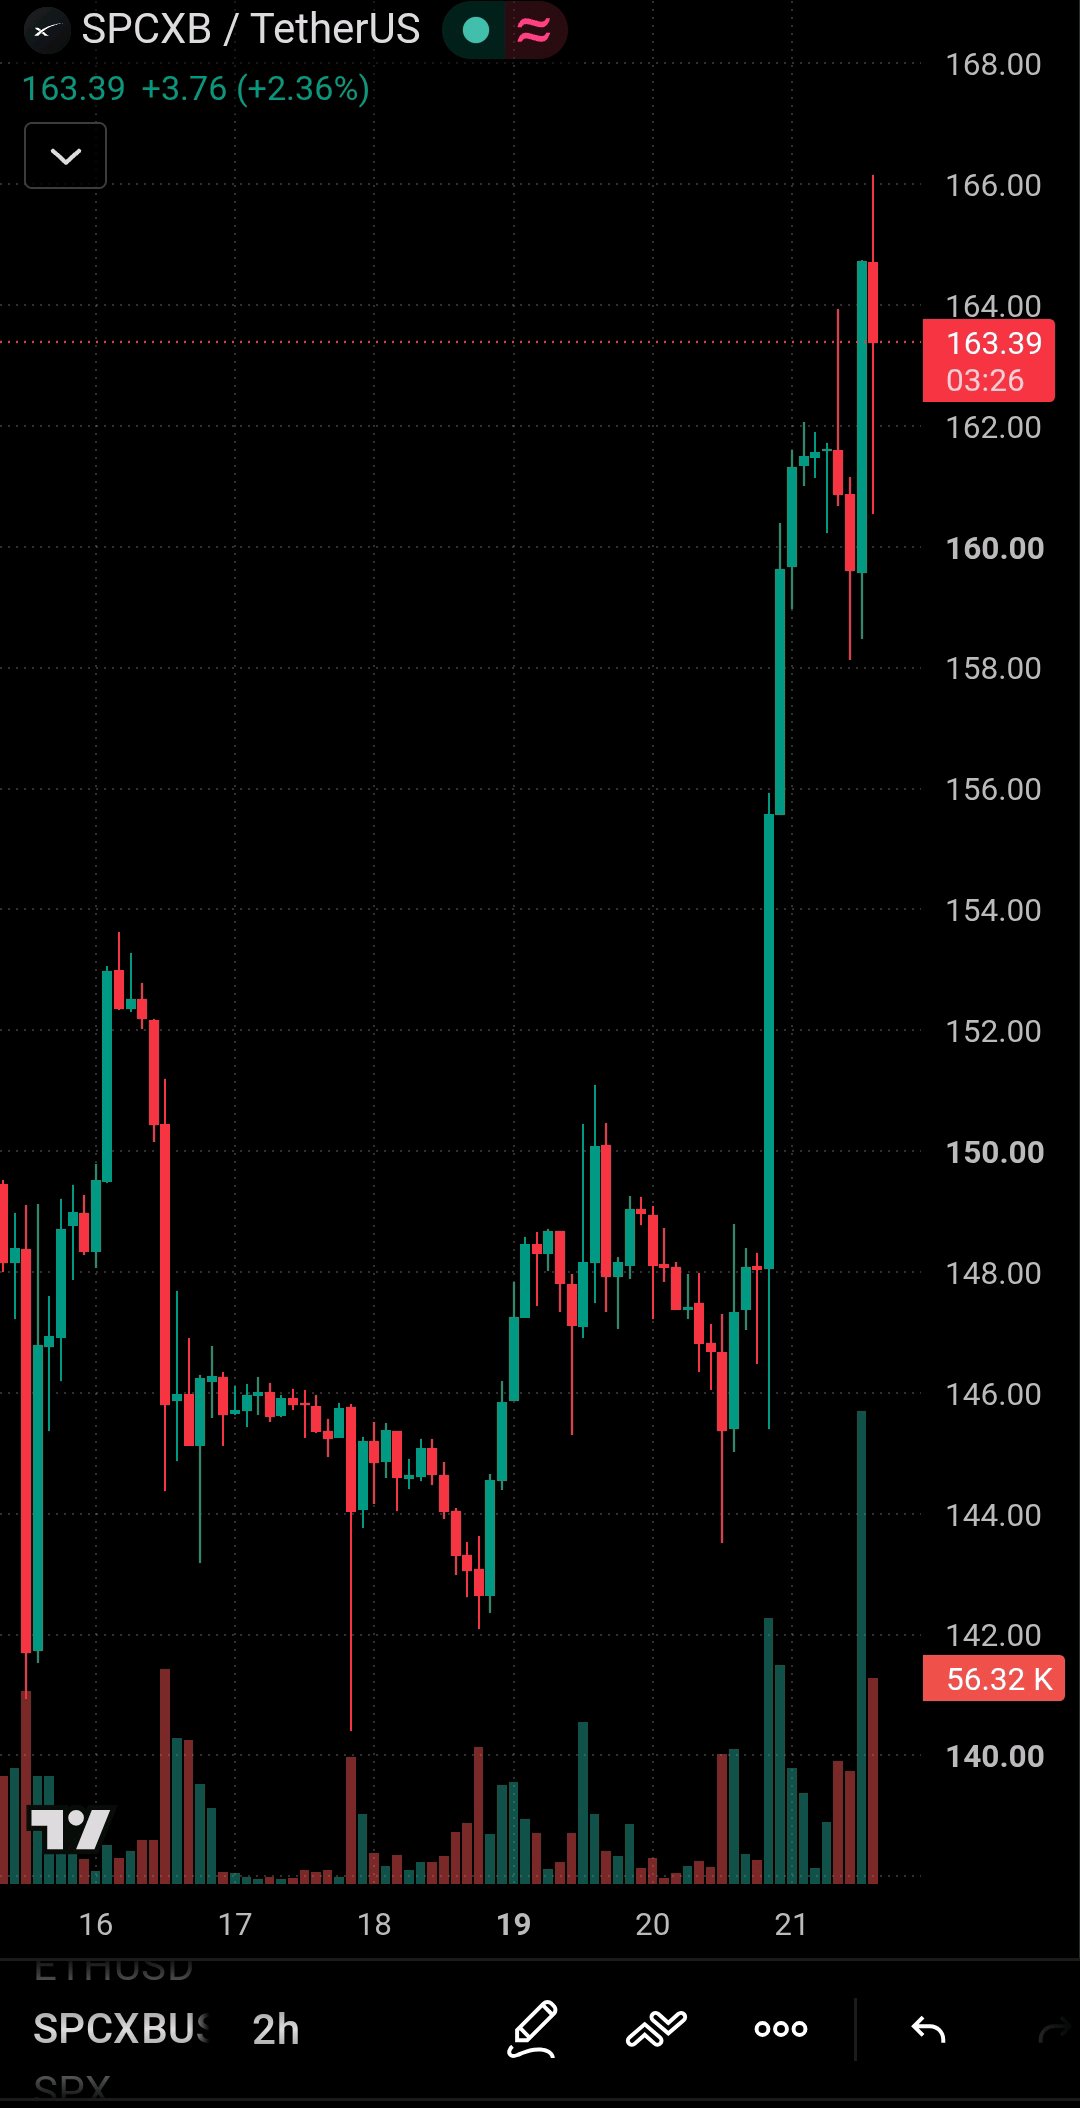
🟢 $SPCX: SpaceX Surges 9% — Is $168 Next?
SpaceX ($SPCXXUSDT ) is back in the spotlight after a powerful rebound, with shares climbing sharply as investors react to stronger-than-expected quarterly results. The big question now is whether buyers can sustain this momentum or whether profit-taking will interrupt the rally. 📊 MARKET OVERVIEW According to market data for October 21, SPCX climbed toward $160 after closing at $147.79 in the previous session. Technical indicators suggest improving momentum, although volatility remains elevated. The latest reported quarterly results also attracted attention, with revenue and earnings exceeding analysts' expectations. This provides a fundamental catalyst behind the renewed market interest. However, strong earnings do not guarantee that a rally will continue. Traders must still watch price action and market sentiment. 🔑 KEY LEVELS TO WATCH 🟢 Immediate support: $158 🟢 Major support: $153 🔴 Immediate resistance: $161–$164 🎯 Upside targets: $168–$170 🚀 Extended target: $180 These are technical reference levels, not guaranteed price outcomes. 🟢 BULLISH SCENARIO If SPCX holds above $158 and breaks through $161–$164 with strong trading volume, buyers could push the price toward $168–$170. A sustained breakout above $170 could open the door toward $180, provided buying pressure remains strong. The key confirmation is whether price can establish support above the breakout zone rather than immediately falling back below resistance. 🔴 BEARISH SCENARIO If SPCX fails to break $161–$164 and loses $158, a pullback toward $153 becomes possible. A breakdown below $153 would weaken the short-term bullish structure and could expose the $148 region. After a sharp rally, profit-taking can create sudden reversals, so traders should avoid assuming that positive earnings will automatically produce further gains. 🎯 MY MARKET VERDICT My bias is cautiously bullish while SPCX holds above $158. The $161–$164 region is the immediate breakout zone to watch. A convincing move above it could strengthen the recovery, while rejection followed by a loss of support would warn that sellers are returning. The professional approach is to separate the fundamental story from the technical setup: strong earnings may support sentiment, but price confirmation determines whether the rally is sustainable. Will SPCX break $164 and target $170, or will sellers defend resistance? #MyByXTake #ByXIMPACT #BybitStocks #USCPI #TOKEN2049
$XRPUSDT is showing signs of recovery, trading around $1.35 on October 21, after rebounding from recent lows. However, the recovery still faces a major test: reclaiming $1.40 and holding above it. 📊 Market Structure Current price: ~$1.35 Resistance: $1.40–$1.42 Next resistance: $1.49–$1.50 Support: $1.30 Major support: $1.25 🟢 Bullish Scenario If XRP breaks above $1.40–$1.42 with strong volume and holds the level, buyers could push toward $1.49–$1.50. A sustained breakout could open the door to further recovery. 🔴 Bearish Scenario If XRP fails to reclaim $1.40 and loses $1.30, selling pressure could bring $1.25 into focus. A breakdown below $1.25 would weaken the structure further. 🎯 My Verdict XRP is attempting a recovery, but the $1.40 level is the battle bulls must win. Until that resistance is reclaimed, caution is warranted. Watch price action and volume for confirmation rather than chasing the bounce. *These levels are based on reported market conditions and are not guarantees. Cryptocurrency prices can change rapidly.* #MyByXTake #ByXIMPACT #BybitStocks #USCPI #TOKEN2049
🚀 ByX IMPACT Is Coming Back — Let’s Build a Stronger Community! The return of the ByX IMPACT Leaderboard on October 26 is more than just a comeback. It’s an opportunity to build a stronger, more active, and more rewarding community. What does the ByX community really want to achieve? 📊 Quality Over Quantity: Encourage creators to share original market analysis, valuable insights, and educational content that helps traders make informed decisions. 🏆 Fair Recognition: Ensure that creators who consistently deliver quality content and meaningful engagement have a fair opportunity to climb the leaderboard and earn rewards. 🤝 Real Community Engagement: Build genuine conversations between traders and creators, where people exchange ideas, discuss market trends, and learn from one another. 💰 Meaningful Rewards: Reward creators in ways that reflect their efforts, consistency, influence, and contributions to the community. 🌱 Equal Opportunities: Give both new and experienced creators a chance to grow, gain visibility, and build their reputation on ByX. 📈 Real Trading Impact: Move beyond likes and views by encouraging content that attracts genuine interest, promotes financial education, and creates meaningful connections with traders. Ultimately, the goal is simple: a community where quality content gets recognized, genuine engagement matters, and creators have a real opportunity to grow. October 26 is the beginning of another chapter. Let's work together to make this season more transparent, competitive, and rewarding for everyone. What matters most is not just bringing the leaderboard back, but making it better for the entire ByX community. 🔥 #ByXIMPACT #MyByXTake


⏳ 5 DAYS TO GO!
The ByX IMPACT Leaderboard returns on October 26! 🔥 Real traders. Real insights. Meaningful conversations. Share your market perspectives, bring your trading insights to the community, and get ready for the comeback. 🚀 The countdown is on. #ByXIMPACT
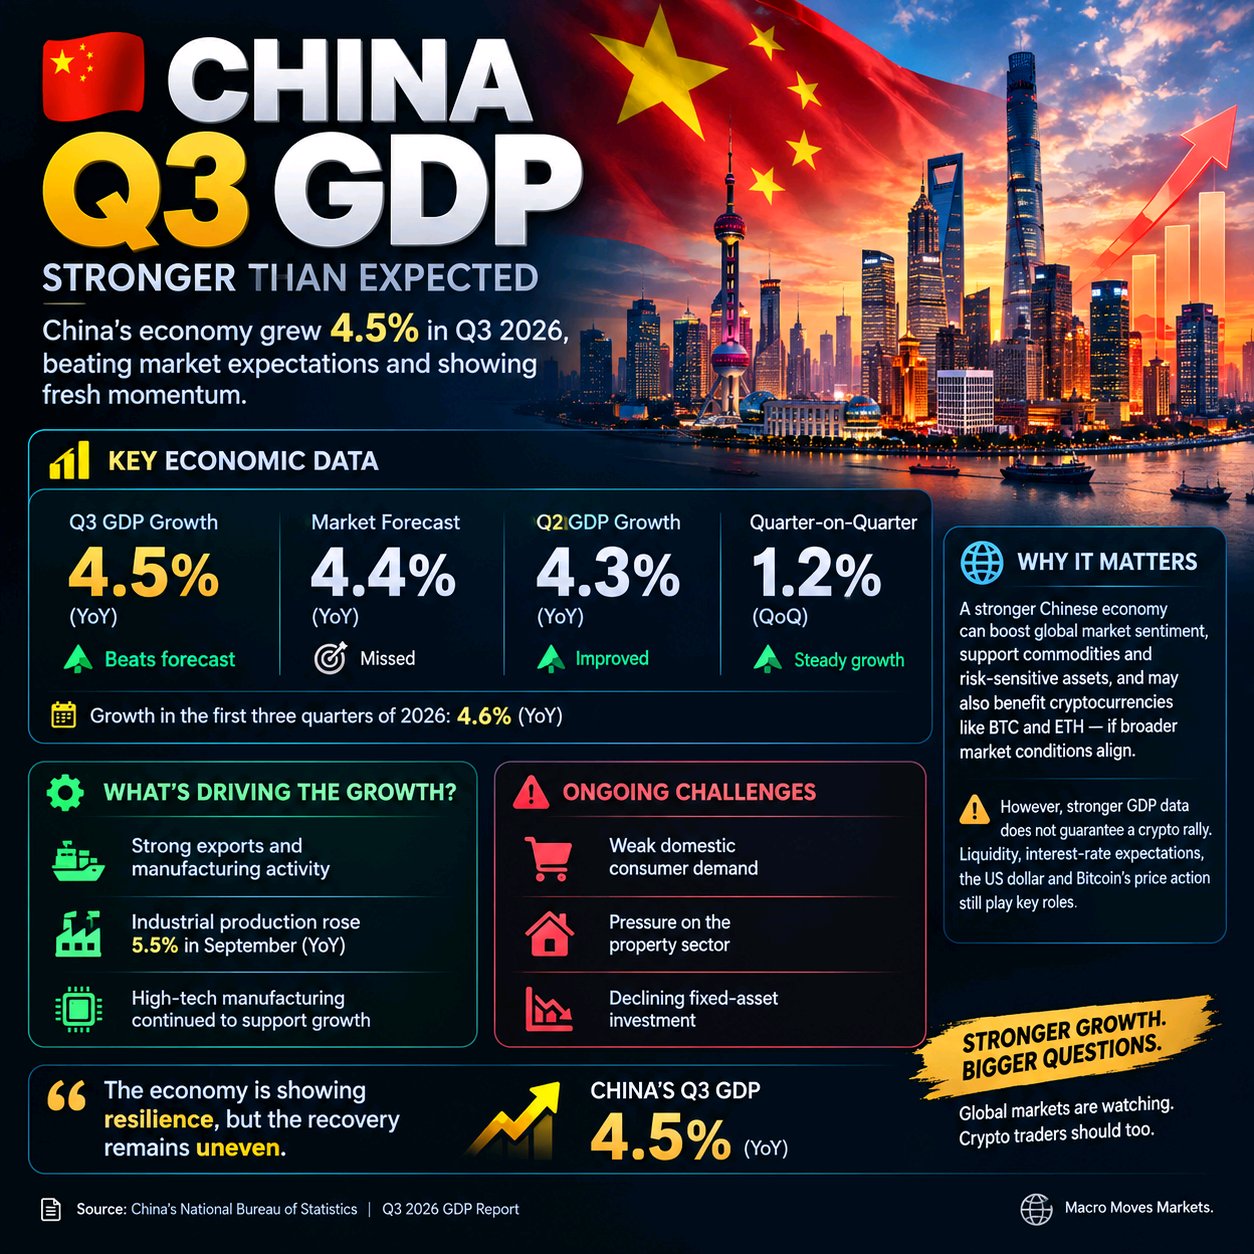
🇨🇳 CHINA GDP SURPRISE: WHAT IT MEANS FOR CRYPTO!
China's Q3 GDP growth has caught the market's attention, with the economy expanding by 4.5% year-on-year, beating expectations of 4.4%. But what does this mean for crypto traders? 👇 📊 KEY ECONOMIC DATA • Q3 GDP Growth: 4.5% • Market Forecast: 4.4% • Q2 GDP Growth: 4.3% China's stronger economic performance could support market confidence, especially across commodities and risk-sensitive assets. However, the bigger picture remains complicated. ⚠️ WHY TRADERS SHOULD PAY ATTENTION A stronger Chinese economy can improve global economic sentiment, potentially encouraging investors to take more risks. This could benefit cryptocurrencies like $BTC and $ETH if broader market conditions also support a rally. However, stronger GDP data does not automatically mean crypto prices will rise. Liquidity conditions, interest-rate expectations, the US dollar, and Bitcoin's price action remain important factors. 🔍 MY MARKET VIEW The GDP numbers are encouraging, but traders should avoid jumping into positions based on one economic report. Watch Bitcoin's reaction, trading volume, and key support and resistance levels before making a decision. BOTTOM LINE: China's economy is showing resilience, but the next move for crypto will depend on how global investors interpret the data and whether buying pressure follows. 📈 Trade the confirmation, not just the headline. #ChinaGDP #Bitcoin #CryptoMarket #BTC #Macro #ByXIMPACT #MyByXTake #BybitStocks #USCPI #MakeYourMove $BTCUSDT $SOLUSDT
🔴 GOLD: Sellers Strike Again — Is $4,000 Next?
🪙 Gold is under renewed selling pressure, and the market is approaching a critical support zone. After failing to sustain its recovery above $4,200, $XAUTUSDT /USD has extended its decline, raising questions about whether buyers can regain control or whether another leg down is developing. The gold market is sending a warning: the bulls need to respond. 📊 MARKET STRUCTURE On October 21, spot gold traded around $4,118 per ounce, extending its decline for a fourth consecutive session. Rising oil prices have increased inflation concerns, while expectations of tighter monetary policy are weighing on the precious metal. The technical picture also remains weak. Gold is trading below several important moving averages, while momentum indicators suggest that sellers retain the short-term advantage. 🔑 KEY LEVELS TO WATCH 🟢 Immediate support: $4,100–$4,067 🟢 Major support: $4,000–$3,990 🔴 Immediate resistance: $4,140–$4,180 🔴 Major resistance: $4,216–$4,235 🔴 BEARISH SCENARIO If gold breaks below $4,067 and fails to reclaim that level, selling pressure could increase toward $4,000. A decisive break below $3,990 would further weaken the structure and potentially expose gold to deeper losses. However, traders should watch for a potential relief bounce around support rather than assume that every downward move will continue. 🟢 BULLISH SCENARIO For buyers to regain control, gold needs to defend the $4,067–$4,100 region and reclaim $4,140–$4,180. A sustained move above $4,180 would improve the short-term outlook, while a breakout above $4,235 would provide stronger evidence of recovery. Until then, any bounce could remain vulnerable to renewed selling. 🎯 MY MARKET VERDICT My current bias is bearish while gold remains below $4,180. The $4,067 area is the immediate level to watch. Losing it could expose the psychological $4,000 zone, while a strong recovery above resistance would weaken the bearish thesis. The bigger picture still depends on US interest-rate expectations, the dollar, Treasury yields, and geopolitical developments. Professional traders don't need to predict every candle. They wait for confirmation, respect invalidation levels, and avoid letting emotions dictate decisions. The question is simple: Will gold defend $4,067, or will sellers push it toward $4,000? #MyByXTake #ByXIMPACT #USCPI #BybitStocks #TOKEN2049


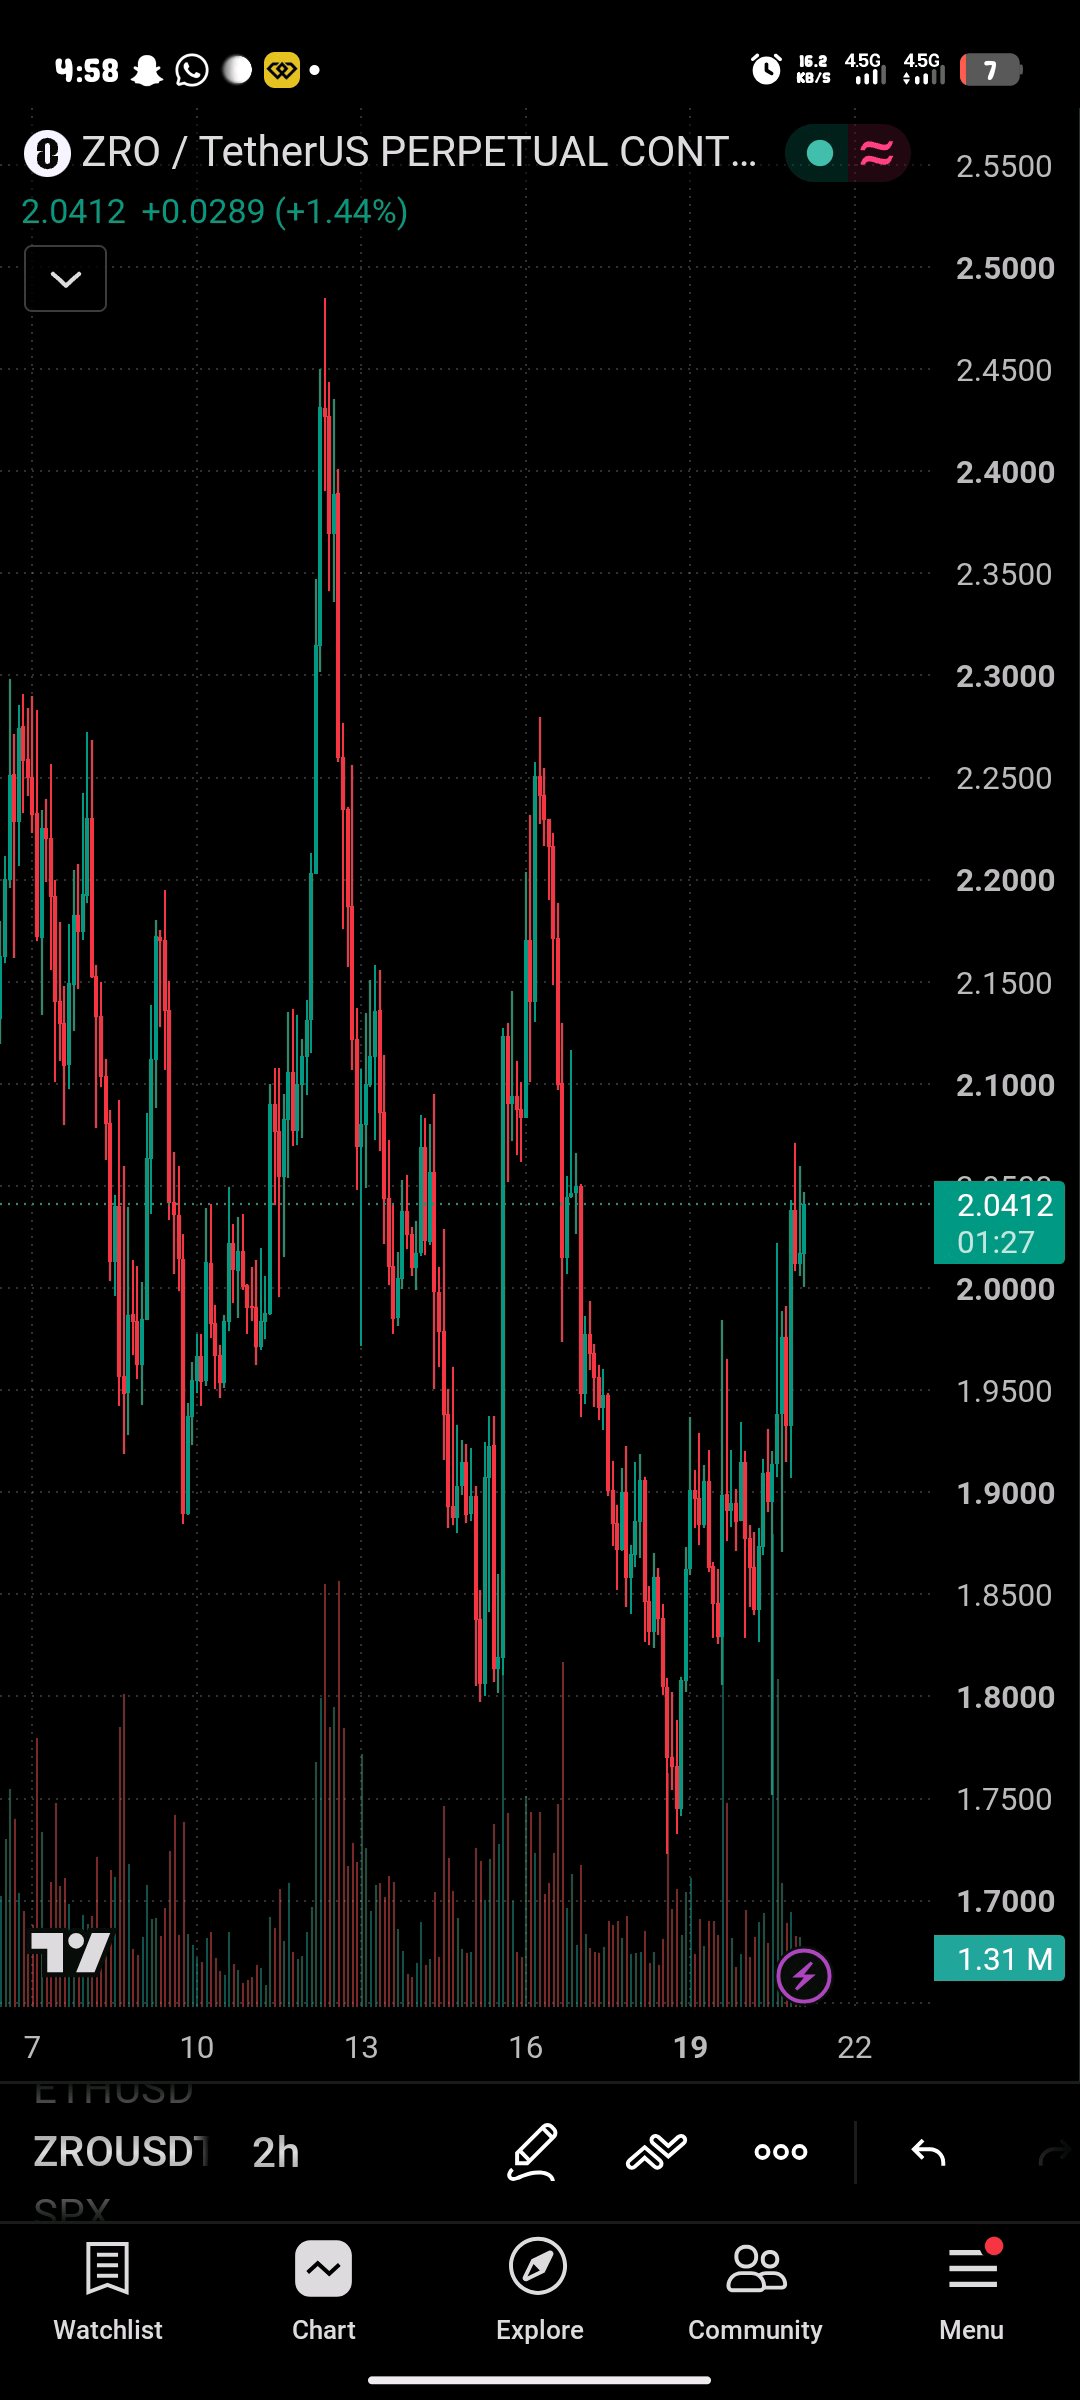
🟢 $ZRO: Bulls Reclaim $2 — Is $2.30 Next?
LayerZero ($ZROUSDT ) is showing renewed bullish momentum, with buyers pushing the price back above the psychological $2.00 level. But the real question is whether this recovery can develop into a sustained breakout or whether sellers will use the rally to apply fresh pressure. The next resistance test could determine ZRO's short-term direction. 📊 MARKET STRUCTURE As of October 21, ZRO is trading around $2.03, with a reported 24-hour gain of approximately 8.5%. The token recently recovered from a low near $1.77 and reached $2.07, showing a strong rebound in buying activity. Short-term technical indicators are broadly positive, but traders should remain cautious. ZRO recently experienced a scheduled token unlock, which may introduce additional supply and increase volatility. The key is determining whether buyers can sustain the recovery despite this potential selling pressure. 🔑 KEY LEVELS TO WATCH 🟢 Immediate support: $1.99–$2.00 🟢 Major support: $1.90–$1.93 🔴 Resistance 1: $2.07–$2.14 🔴 Resistance 2: $2.27–$2.30 🎯 Extended bullish target: $2.50 These are technical reference zones based on recent market data, not guaranteed price destinations. 🟢 BULLISH SCENARIO If ZRO maintains support around $2.00 and breaks above $2.14 with strong volume, buyers could gain the momentum needed to challenge $2.27–$2.30. A confirmed breakout above $2.30 would strengthen the bullish structure and potentially open the way toward $2.50. However, the breakout needs sustained buying pressure. A quick spike above resistance without follow-through could become a bull trap. 🔴 BEARISH SCENARIO If ZRO fails to clear $2.07–$2.14 and loses $1.99, the recovery could weaken. A breakdown below $1.90 would increase the risk of a deeper pullback, particularly if broader market conditions deteriorate or token-unlock-related selling pressure persists. The $2.00 level is important psychologically, but holding it alone does not confirm a bullish reversal. 🎯 MY MARKET VERDICT My bias is cautiously bullish while ZRO holds near $2.00, but confirmation above $2.14 is essential. The strongest bullish signal would be a breakout above resistance accompanied by rising volume and a successful retest. On the other hand, losing $1.99 would warn that buyers may be struggling to maintain control. For now, ZRO is showing recovery momentum, but the market still needs to prove that this move can continue. Watch $2.14 closely. A convincing breakout could put $2.30 back in focus. Remember: Good analysis is about identifying scenarios, managing risk, and recognizing when the market invalidates your thesis—not predicting every move correctly. #MyByXTake #ByXIMPACT #USCPI #BybitStocks #TOKEN2049
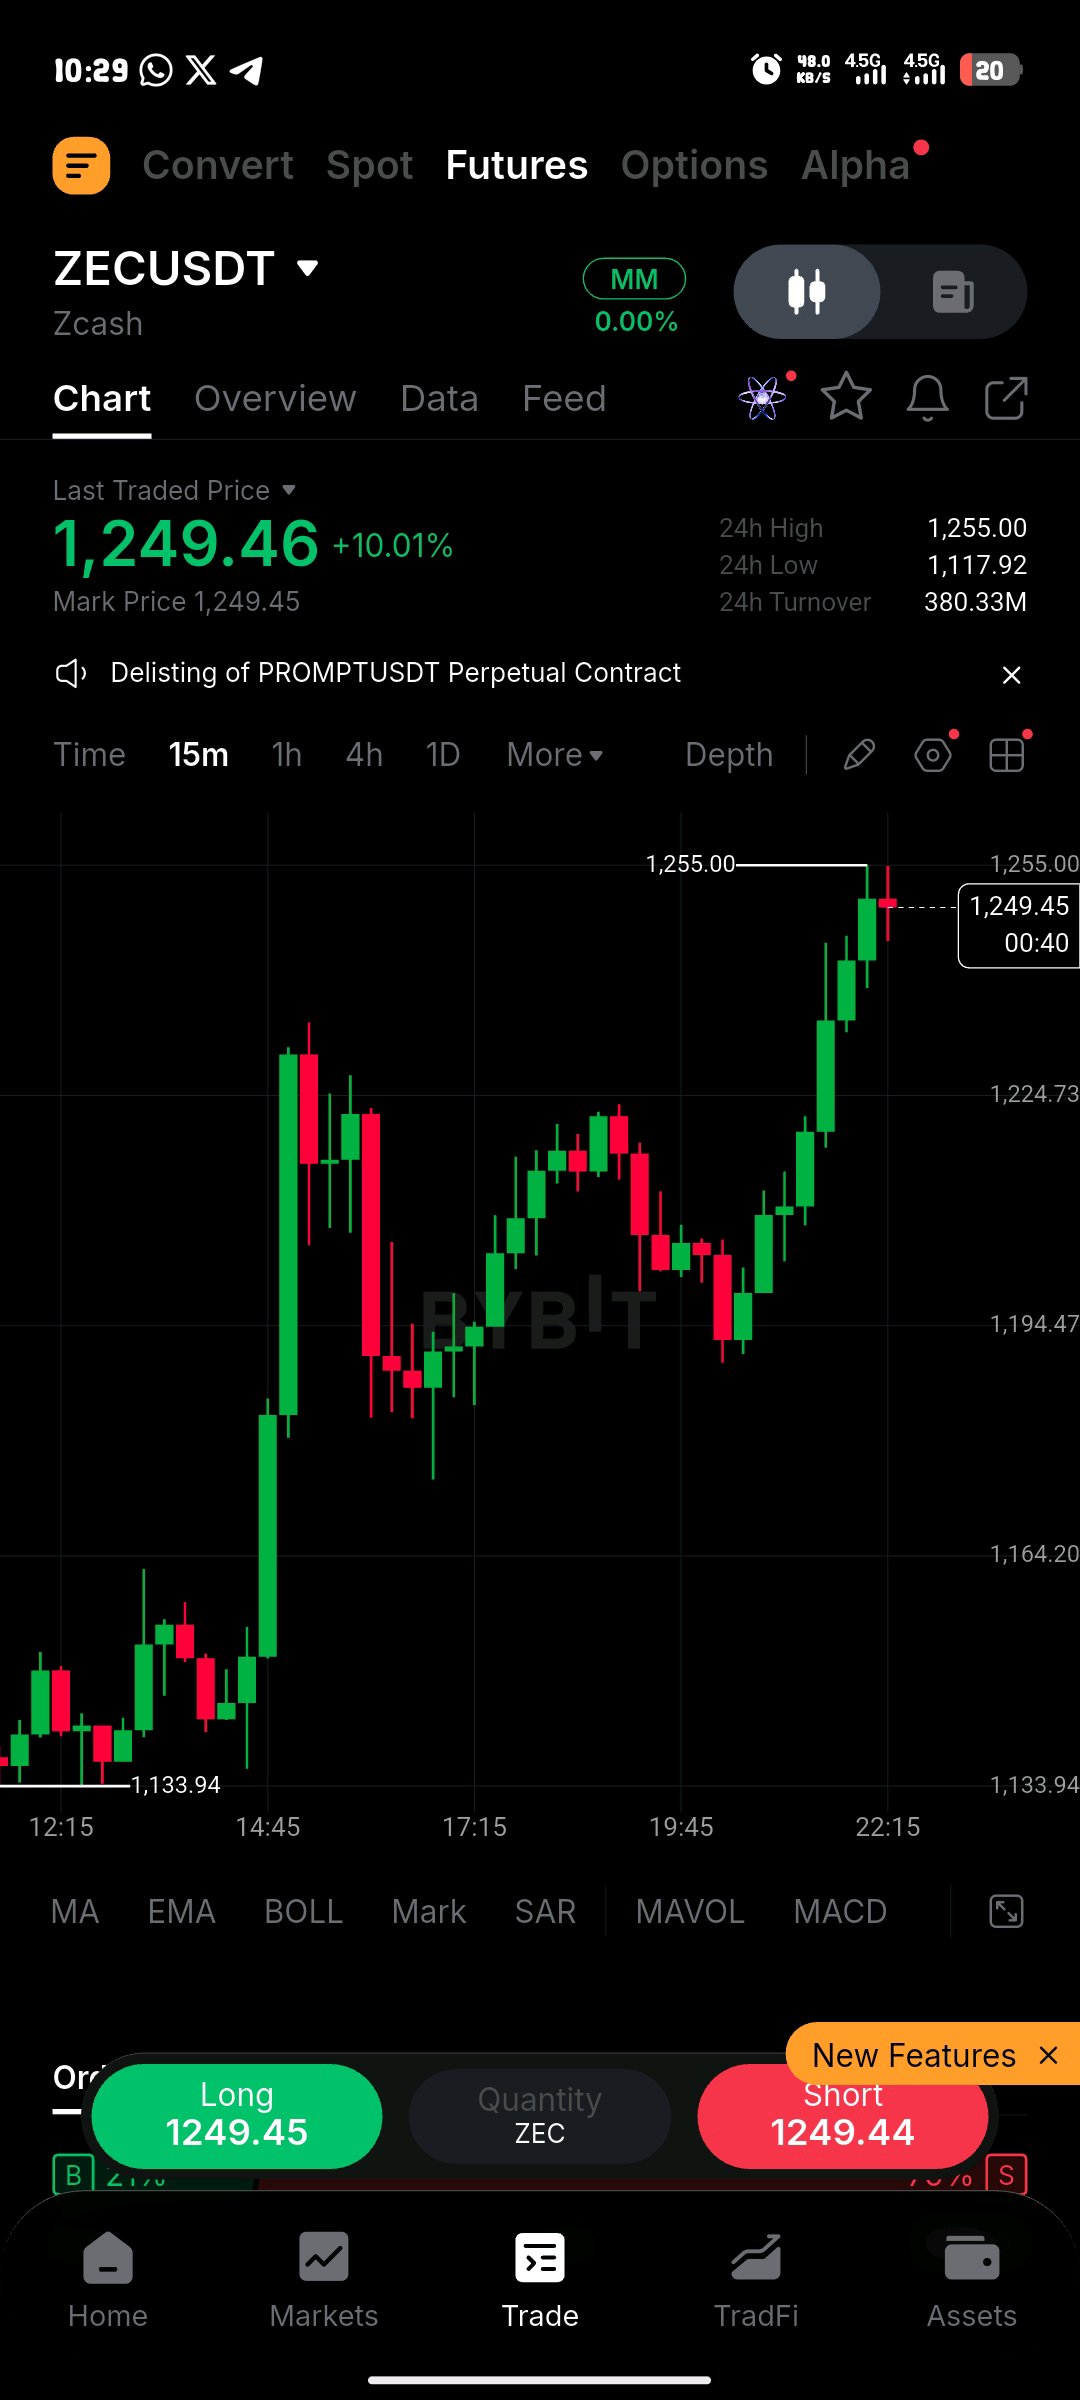
🟢 $ZEC: Bulls Strike Back — Is $1,300 Next?
Zcash ($ZEC) is making a strong comeback, gaining approximately 5–9% in 24 hours and outperforming much of the broader crypto market. With price trading around $1,200–$1,225, the big question is whether buyers have enough momentum to push toward $1,300 or whether sellers will trigger another rejection. The market is approaching a critical decision zone. 📊 MARKET STRUCTURE ZEC is showing renewed bullish momentum after recovering from recent selling pressure. Technical indicators on shorter timeframes have turned positive, suggesting buyers are regaining control. However, the daily structure remains mixed. Price is approaching resistance, and volatility is elevated. This means the next move could be aggressive in either direction. According to market data from October 20, the key daily resistance is around $1,233, while major support sits near $1,105. 🔑 KEY LEVELS TO WATCH 🟢 Immediate support: $1,170–$1,185 🟢 Major support: $1,105–$1,115 🔴 Immediate resistance: $1,225–$1,233 🎯 Bullish target 1: $1,300–$1,304 🎯 Bullish target 2: $1,385 ⚠️ Major downside level: $1,024 🐂 BULLISH SCENARIO If ZEC holds above $1,170–$1,185 and breaks through $1,233 with strong volume, buyers could push toward $1,300. A confirmed breakout above $1,304 would strengthen the bullish structure and potentially open the way toward $1,385. The important factor is confirmation. A quick spike above resistance without sustained buying pressure could become a false breakout. 🐻 BEARISH SCENARIO If ZEC fails to break $1,233 and loses the $1,170 support zone, a pullback toward $1,115 becomes possible. A decisive daily close below $1,105 would weaken the bullish outlook and bring the $1,024 region into focus. With volatility this high, chasing green candles without a clear plan can be risky. 🎯 MY MARKET VERDICT My bias is cautiously bullish while ZEC holds above $1,170, but $1,233 is the level that matters most. A confirmed breakout could create room for another upward move toward $1,300. Failure to break resistance, however, could lead to a deeper correction. ZEC has momentum, but momentum alone does not guarantee continuation. Watch volume, market structure, and Bitcoin's direction before drawing conclusions. The key question: Will ZEC break $1,233 and extend its rally, or will sellers defend resistance once again? #MyByXTake #ByXIMPACT #BybitStocks #USCPI #MakeYourMove $ZENUSDT $BTCUSDT
🟢 $SOL: Bulls Defend $100 — Is $112 Next?
Solana is approaching a critical turning point. With $SOLUSDT trading around $104–$105, the market is testing whether buyers can regain momentum or whether sellers will push the price back toward the psychological $100 support level. The next move could determine SOL's short-term direction. 📊 MARKET STRUCTURE SOL is currently trading below key short-term moving averages, indicating that recovery momentum remains under pressure. However, buyers have continued defending the $100–$103 region, making this an important zone to monitor. According to market data published on October 20, SOL's immediate technical resistance is around $106.50, while nearby support sits around $103.50. Stronger support is located near $100. 🔑 KEY LEVELS 🟢 Major support: $100–$103.50 🔴 Immediate resistance: $106.50–$109 🎯 Bullish targets: $112–$116 ⚠️ Lower support: $97–$98 🟢 BULLISH SCENARIO If SOL holds above $103 and buyers reclaim $106.50 with strong volume, the price could attempt a move toward $109. A convincing breakout above $109 could open the door toward $112, followed by $116 if bullish momentum strengthens. The key confirmation is a sustained breakout, not simply a temporary spike. Traders should also monitor Bitcoin because renewed weakness across the broader market could undermine SOL's recovery. 🔴 BEARISH SCENARIO If SOL loses $103 and fails to reclaim it, selling pressure could push the price toward the $100 psychological support zone. A decisive daily close below $100 would weaken the recovery outlook and could expose the $97–$98 region. If buyers fail to defend that lower zone, the market may experience another leg down. 🎯 MY MARKET VERDICT SOL is at a decision point, and $100 remains the level bulls cannot afford to ignore. My outlook is cautiously neutral until SOL establishes a clear breakout above $106.50–$109 or confirms a breakdown below support. A move above $109 would strengthen the bullish case toward $112–$116. Conversely, losing $100 would increase downside risk. The smartest approach is to follow price confirmation rather than chase candles based on emotion. Remember: The best setups are built on confirmation, clear invalidation levels, and disciplined risk management—not predictions alone. What matters now is simple: Will SOL reclaim $109, or will sellers force another test of $100? #MyByXTake #ByXIMPACT #BybitStocks #USCPI #TOKEN2049
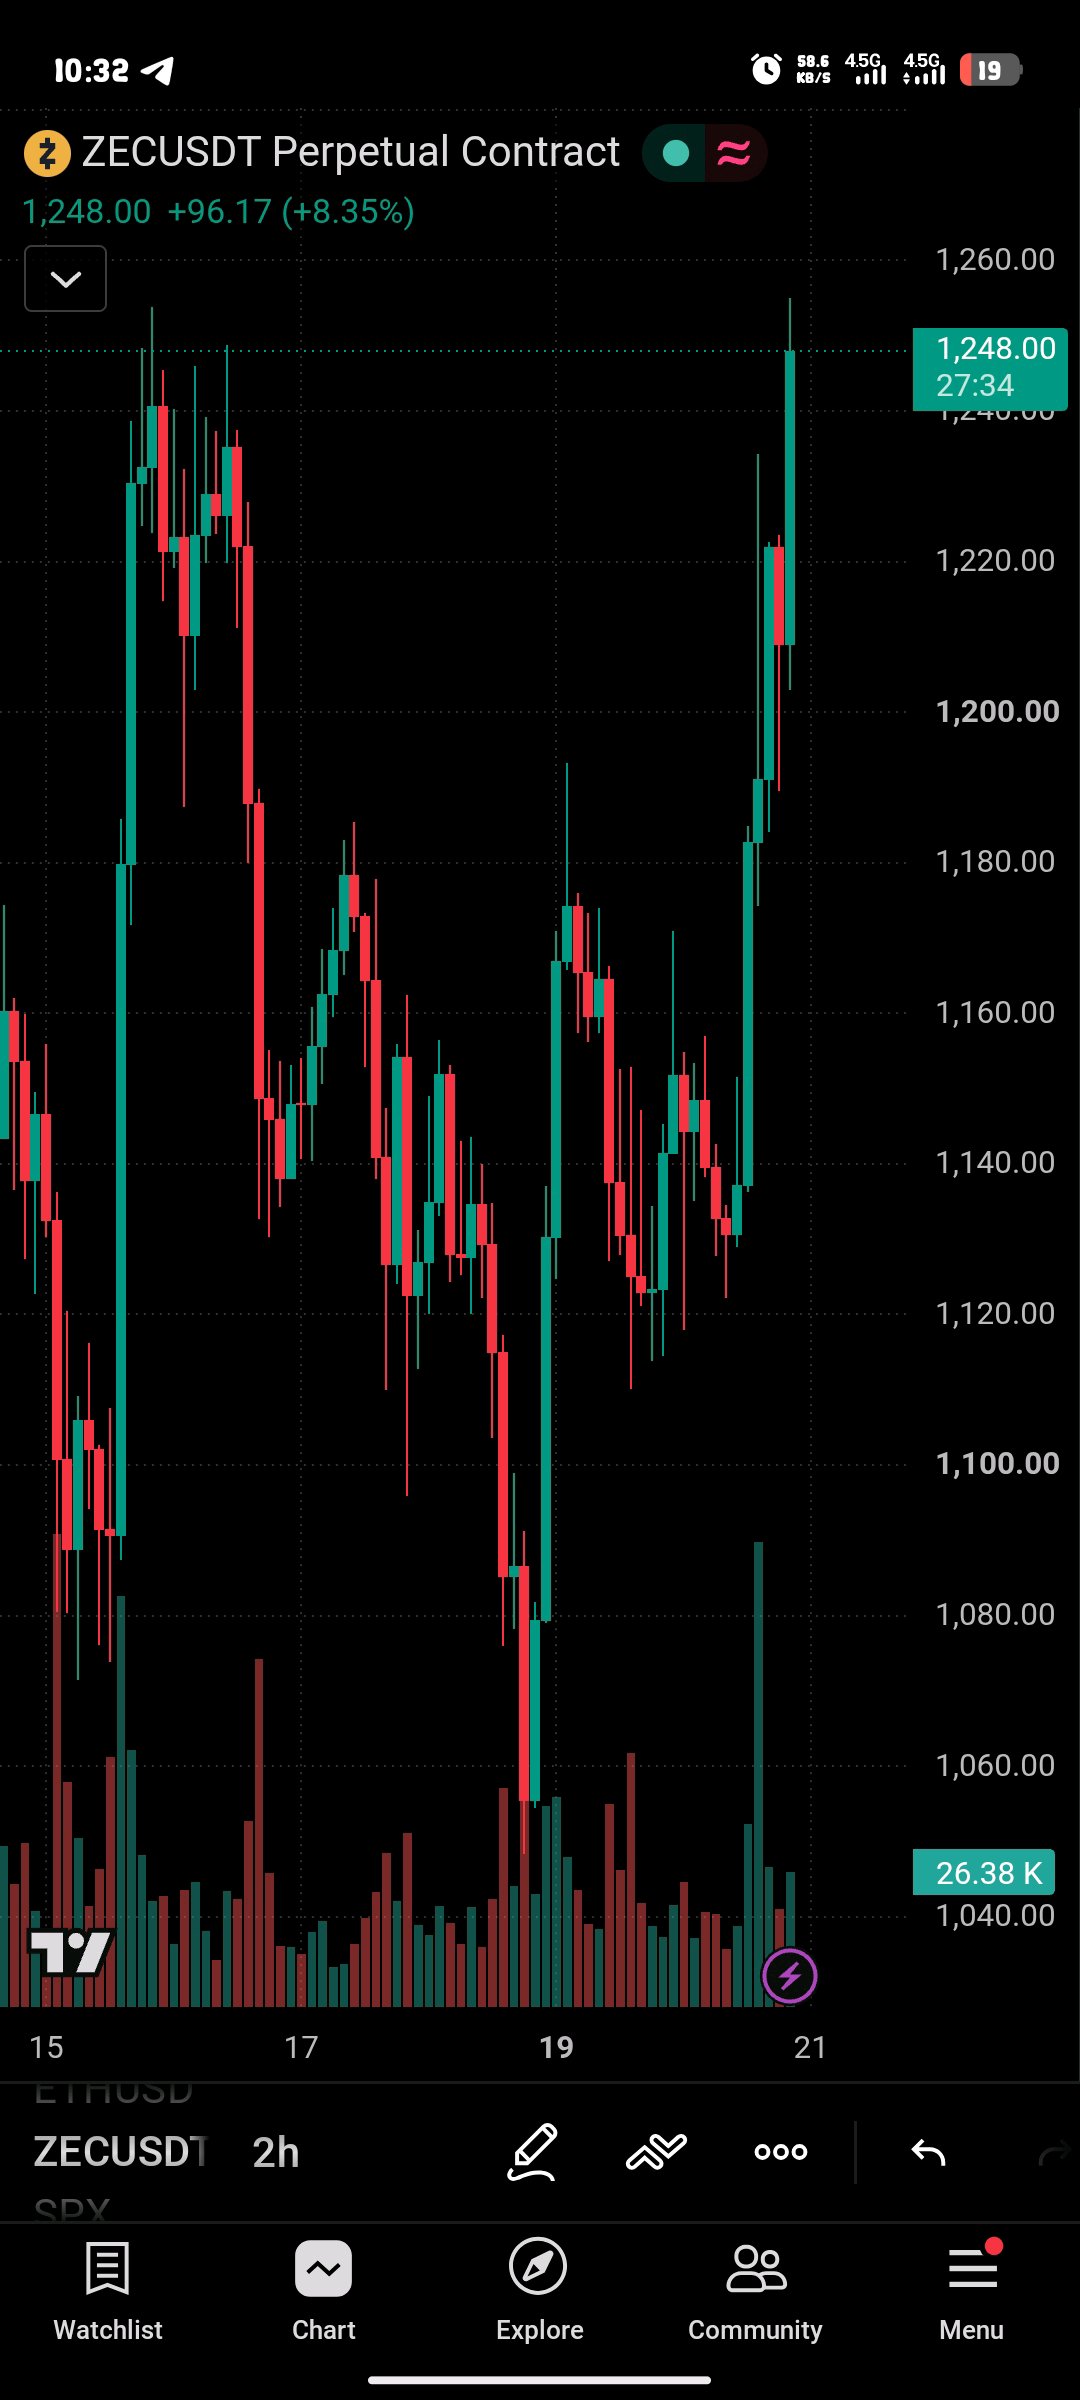
🔴 $GRIFFAIN: Recovery Attempt or Another Leg Down?
🟢GRIFFAIN is approaching a critical decision zone. After recent selling pressure, the token is showing signs of short-term stabilization, but buyers still need to prove they can regain control. At approximately $0.0147, GRIFFAIN remains below its early-October highs. The key question is whether this recovery can develop into a sustained reversal or simply become another opportunity for sellers. 📊 MARKET STRUCTURE Recent price data shows GRIFFAIN declining from around $0.0255 in early October toward the $0.0140–$0.0150 region. This represents a significant correction, and the broader structure remains vulnerable until price establishes stronger higher highs and higher lows. Momentum indicators are mixed. RSI is near neutral, while MACD remains bearish. Trading volume is also relatively low compared with stronger activity during previous moves, meaning any breakout needs confirmation. 🔑 KEY LEVELS TO WATCH 🟢 Support zone: $0.0140–$0.0143 🟢 Major support: $0.0135 🔴 Immediate resistance: $0.0150–$0.0155 🔴 Higher resistance: $0.0160–$0.0167 🎯 Extended recovery zone: $0.0175–$0.0200 🐂 BULLISH SCENARIO If buyers defend $0.0140 and push price above $0.0155 with increasing volume, GRIFFAIN could attempt a recovery toward $0.0160–$0.0167. A convincing breakout above $0.0167 would strengthen the recovery structure and potentially open the door toward $0.0175 and $0.0200. However, a brief move above resistance without sustained buying pressure would not be sufficient confirmation. 🐻 BEARISH SCENARIO If GRIFFAIN loses $0.0140 and fails to reclaim it, the next area to watch is around $0.0135. A breakdown below that level could expose the token to further downside, especially if Bitcoin weakens and liquidity across smaller altcoins deteriorates. Traders should also be aware that lower liquidity can amplify price swings in either direction. 🎯 MY MARKET VERDICT My current assessment is cautious below $0.0155. GRIFFAIN needs a convincing reclaim of resistance before a stronger bullish reversal becomes credible. Until then, the recent stabilization should be treated as a potential recovery attempt rather than confirmation of a new uptrend. The levels that matter most are $0.0140 on the downside and $0.0155 on the upside. A decisive move beyond either boundary could provide a clearer signal about the next direction. Remember: A falling price does not automatically mean a bargain, and a green candle does not automatically signal a reversal. Market structure, volume, and confirmation matter. #MyByXTake #ByXIMPACT #USCPI #BybitStocks #TOKEN2049 $BTCUSDT $BRUSDT

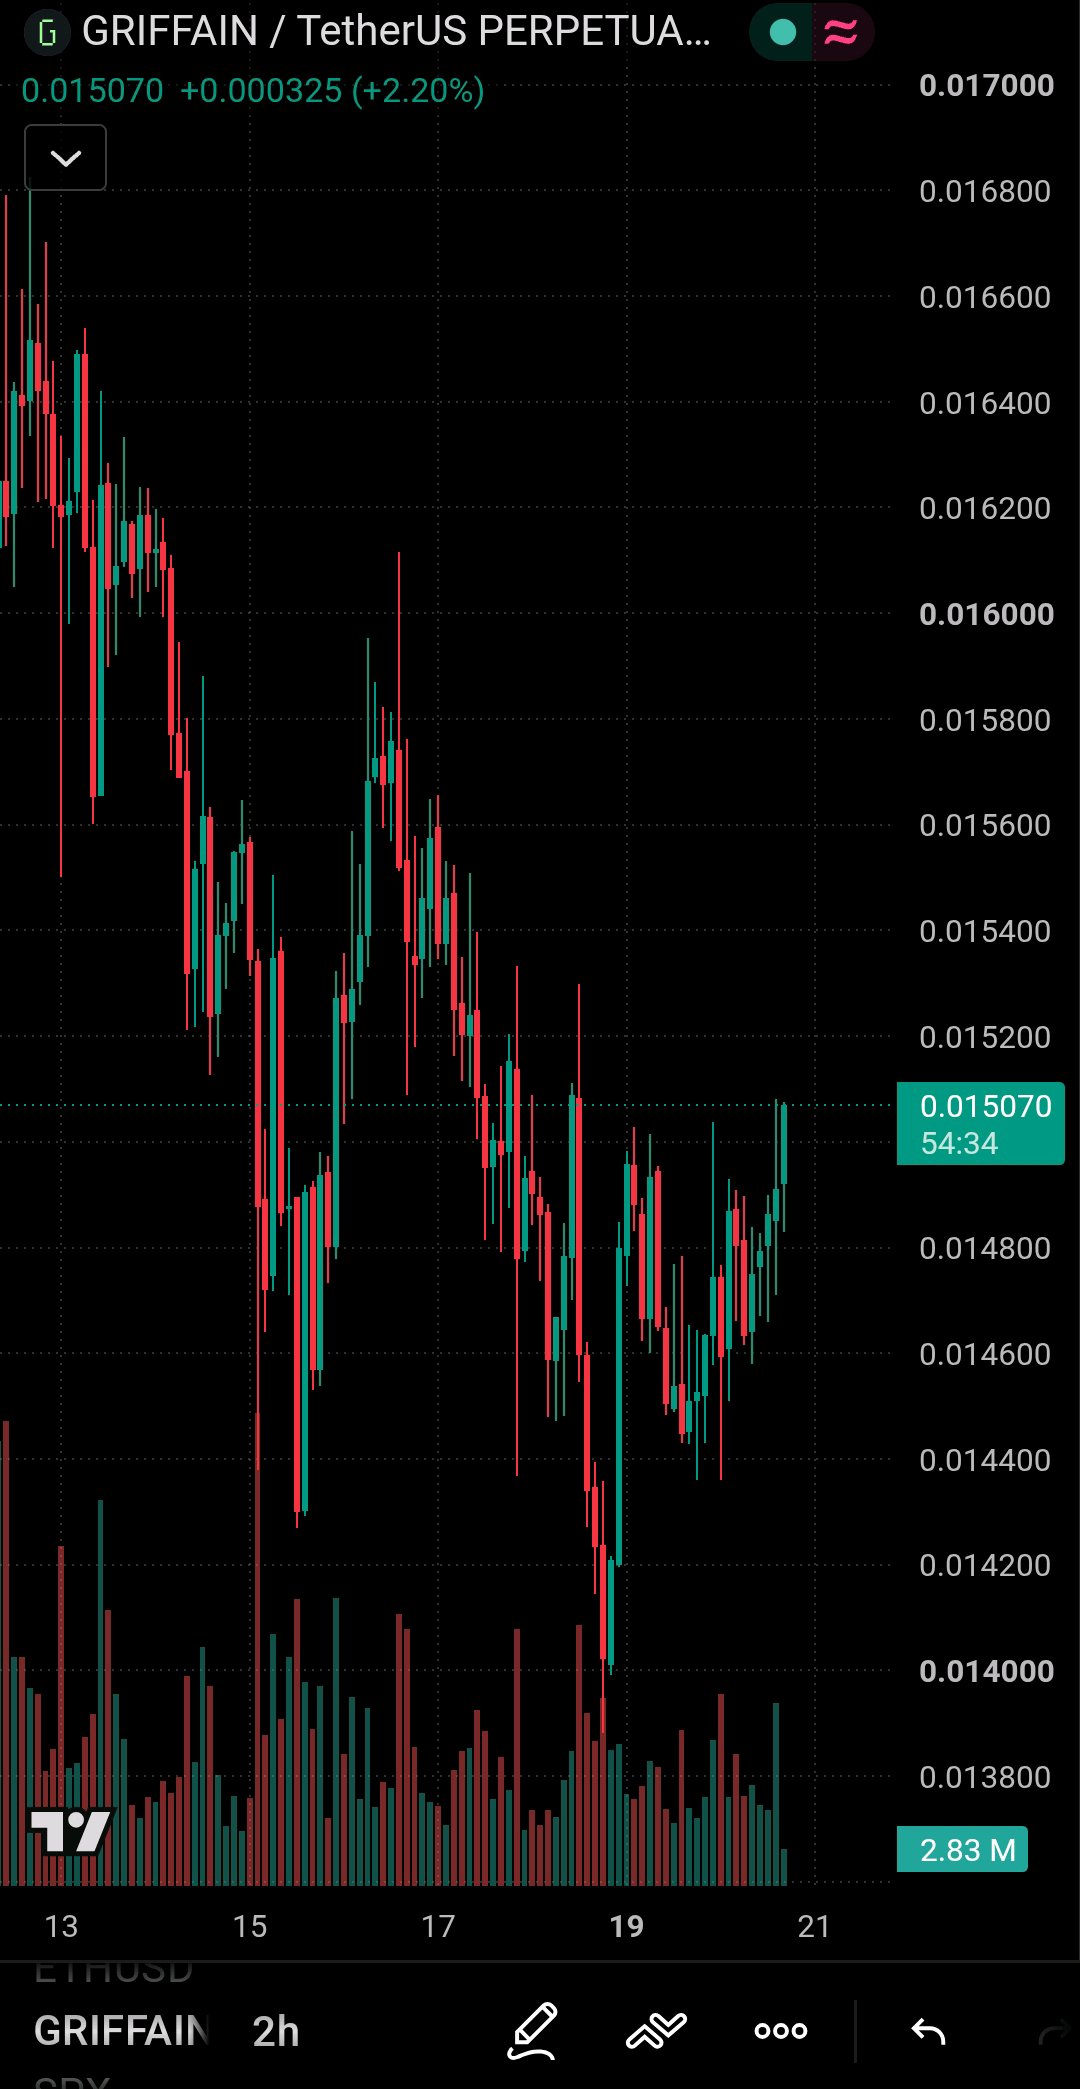
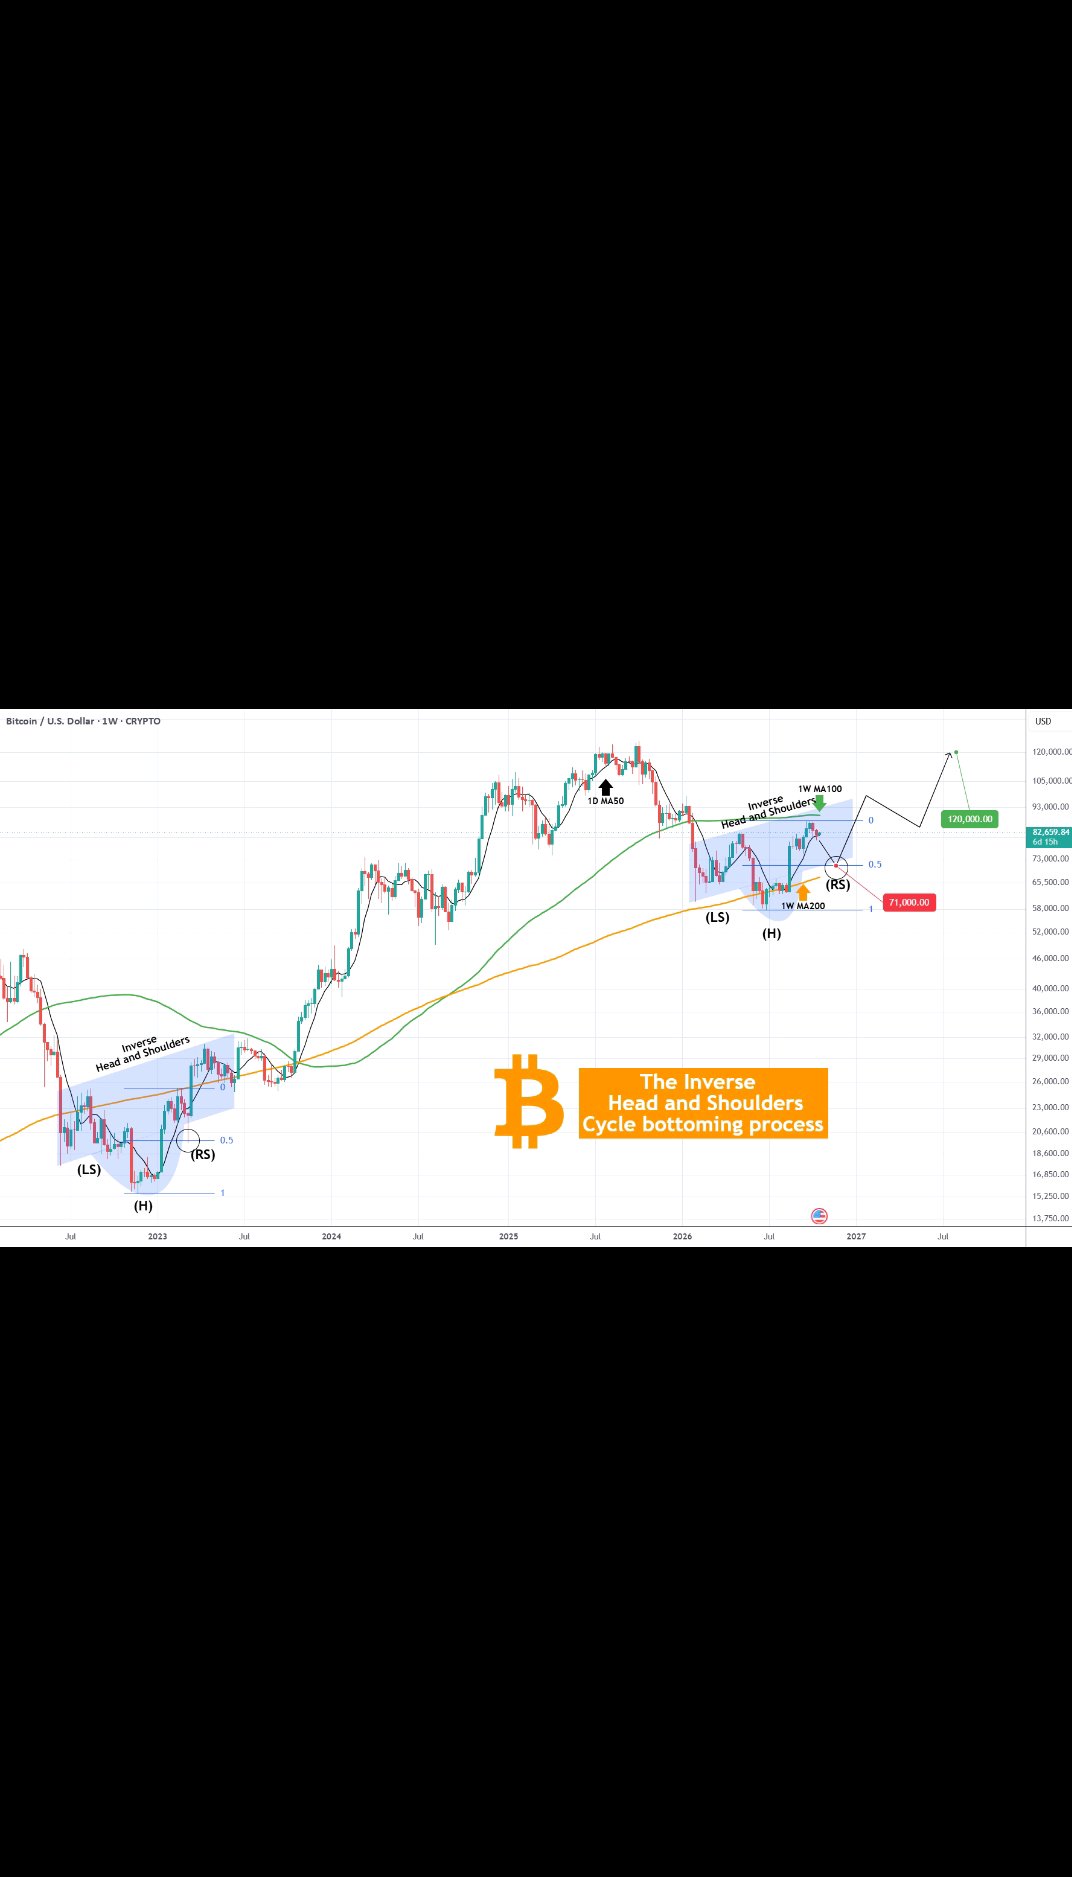
Bitcoin ($BTCUSDT ) has been following so far very closely the late 2022 - early 2023 Cycle bottoming process, which was an Inverse Head and Shoulders (IH&S) pattern that transitioned the market from the Bear to the Bull Cycle. This time it appears that the 1W MA100 (green trend-line) is working as the Resistance that could push BTC downwards in order to complete the Right Shoulders (RS) of the IH&S pattern. In 2023 that made a Higher Low on the 0.5 (blue) Fibonacci retracement level. That Bearish Leg was triggered once the price closed a daily candle below its 1D MA50 (black trend-line). As a result, if we get the same 1D MA50 closing (so far is holding strongly as despite successive breaks, it has always managed to close above it in recent days), we expect a 0.5 Fib test around $71000. At this stage even another 1W MA200 (orange trend-line) test a little lower ($68000) can't be ruled out. So are you expecting such a technical pull-back to take place, complete the IH&S and then initiate a new long-term uptrend to and beyond $100000? Feel free to let us know in the comments section below! #MyByXTake #ByXIMPACT #BybitStocks #USCPI #TOKEN2049
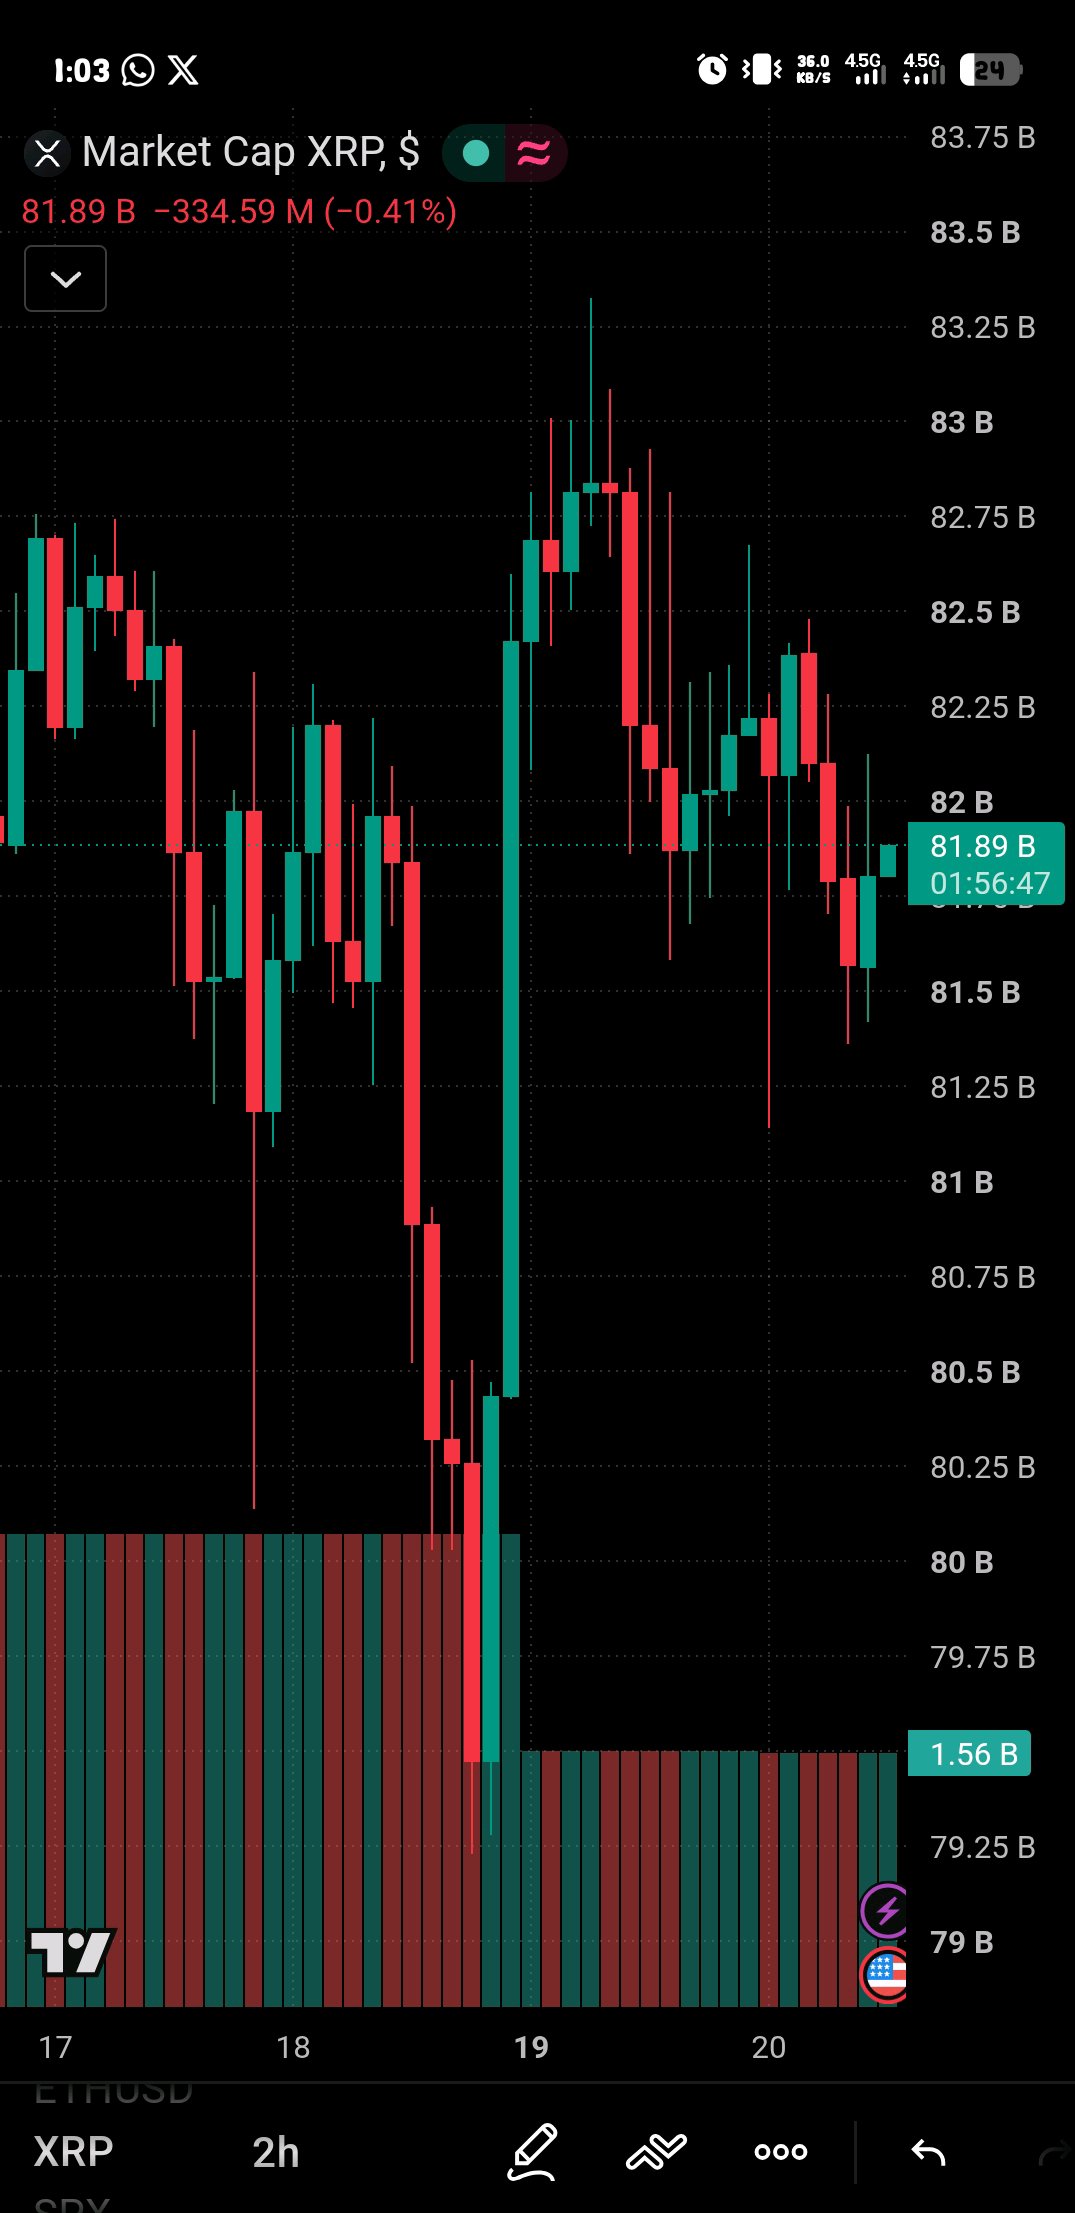
🔴 $XRP: Bulls Must Defend $1.28 or Risk a Drop
$XRPUSDT is approaching a critical decision zone. Trading around $1.30, the market is showing signs of weakness, and the next move could determine whether buyers can regain control or sellers extend the correction. 📊 MARKET STRUCTURE XRP remains under short-term pressure. Momentum indicators are weak, with the daily RSI around 37 and MACD signaling bearish conditions. Price is also trading below several key moving averages, suggesting that buyers have yet to establish a convincing recovery. However, price is approaching an important support zone where a reaction from buyers could develop. The key is to watch how XRP behaves around support rather than assume a reversal is guaranteed. 🔑 KEY LEVELS TO WATCH 🟢 Support: $1.28–$1.25 🔴 Immediate resistance: $1.32–$1.35 ⚠️ Major resistance: $1.38–$1.40 🐂 BULLISH SCENARIO If XRP holds the $1.28 support zone and reclaims $1.32–$1.35 with strong buying volume, bullish momentum could begin to recover. A sustained breakout above $1.35 would strengthen the recovery setup, potentially opening the way toward $1.38 and $1.40. For a stronger bullish confirmation, buyers need to reclaim resistance and demonstrate that the breakout can hold. A temporary price spike without volume could turn into a false breakout. 🐻 BEARISH SCENARIO If XRP loses $1.28 and fails to recover that level, selling pressure could increase. A confirmed breakdown would put $1.25 in focus, with the possibility of further downside if broader crypto-market weakness continues. Bitcoin's direction and overall market liquidity will remain important factors. Even a technically promising XRP setup can fail when the broader market is under pressure. 🎯 MY TRADER'S VERDICT My current bias is cautiously bearish below $1.35. I would watch for either a confirmed reclaim of resistance or a breakdown below support before drawing a stronger directional conclusion. The $1.28 level is particularly important: holding it could give bulls an opportunity to recover, while losing it would weaken the structure further. The opportunity is not simply about predicting the next candle. It is about waiting for confirmation, defining invalidation, and managing risk. Remember: Support is not guaranteed to hold, and resistance is not guaranteed to reject price. These levels are technical reference points, not promises. #MyByXTake #ByXIMPACT #USCPI #BybitStocks #TOKEN2049 $MNTUSDT
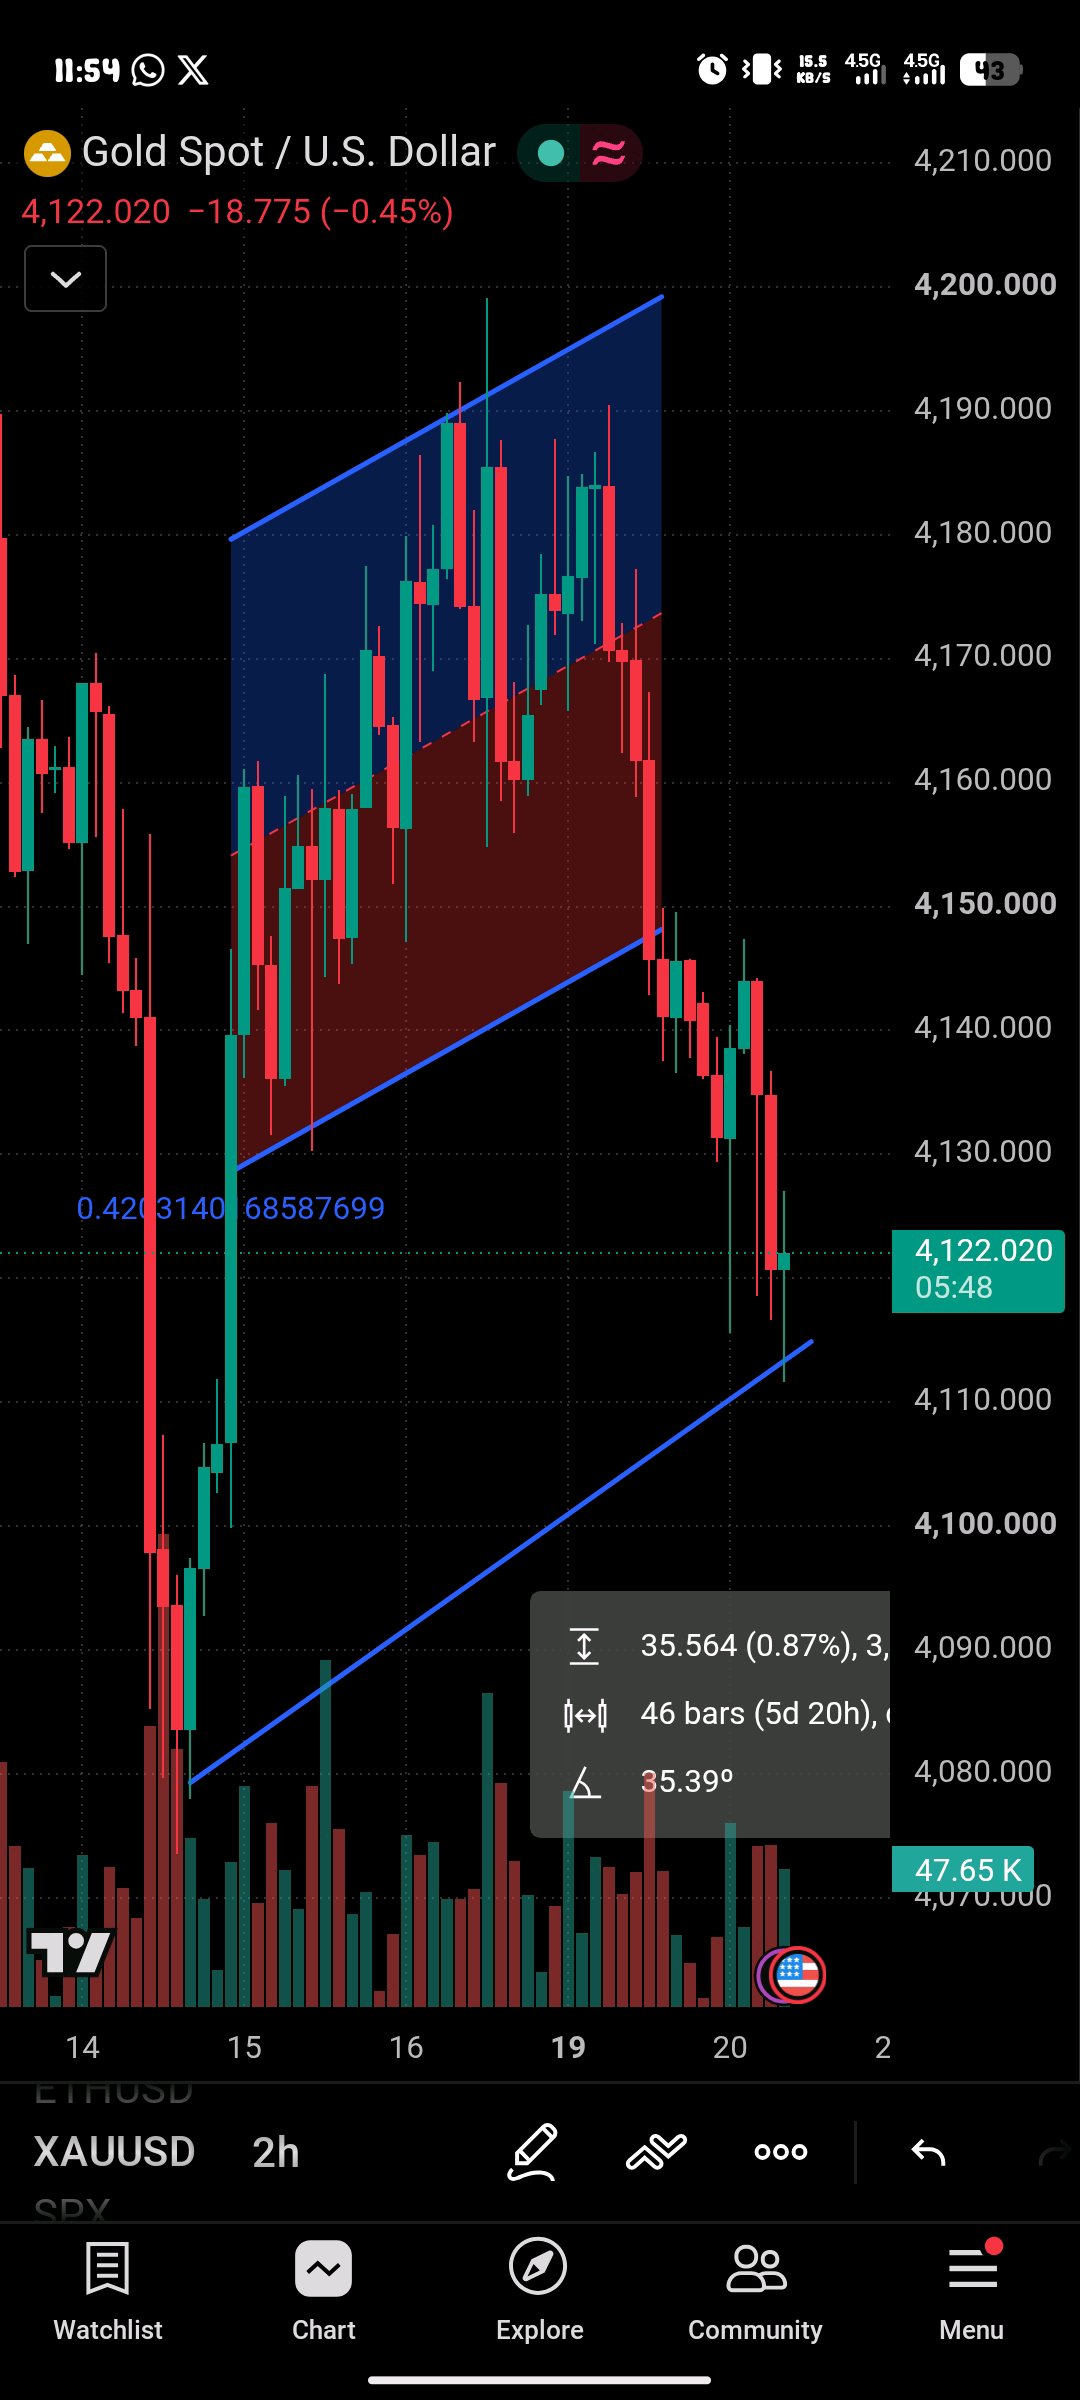
🔴 $GOLD: SELLERS ARE TAKING CONTROL!
Gold is facing renewed selling pressure as rising oil prices fuel inflation concerns and investors prepare for the Federal Reserve’s upcoming policy meeting. On October 20, spot gold traded around $4,129 per ounce, extending its recent decline. 🔴 BEARISH SCENARIO If gold remains below the $4,200 resistance zone, sellers may continue to dominate. A break below nearby support could trigger further downside. 🟢 BULLISH SCENARIO If buyers defend support and gold reclaims the $4,200 level, a recovery could develop as the US dollar weakens or safe-haven demand increases. 🎯 MY TAKE Gold is showing short-term weakness, but the next Federal Reserve decision could bring significant volatility. I would watch the $4,200 area for signs of recovery and monitor support for confirmation of further downside. The key question: Is this a temporary correction or the beginning of a deeper decline? 🔥 Are you bullish or bearish on $GOLD? #MyByXTake #ByXIMPACT #BybitStocks #USCPI #TOKEN2049 $XAUTUSDT
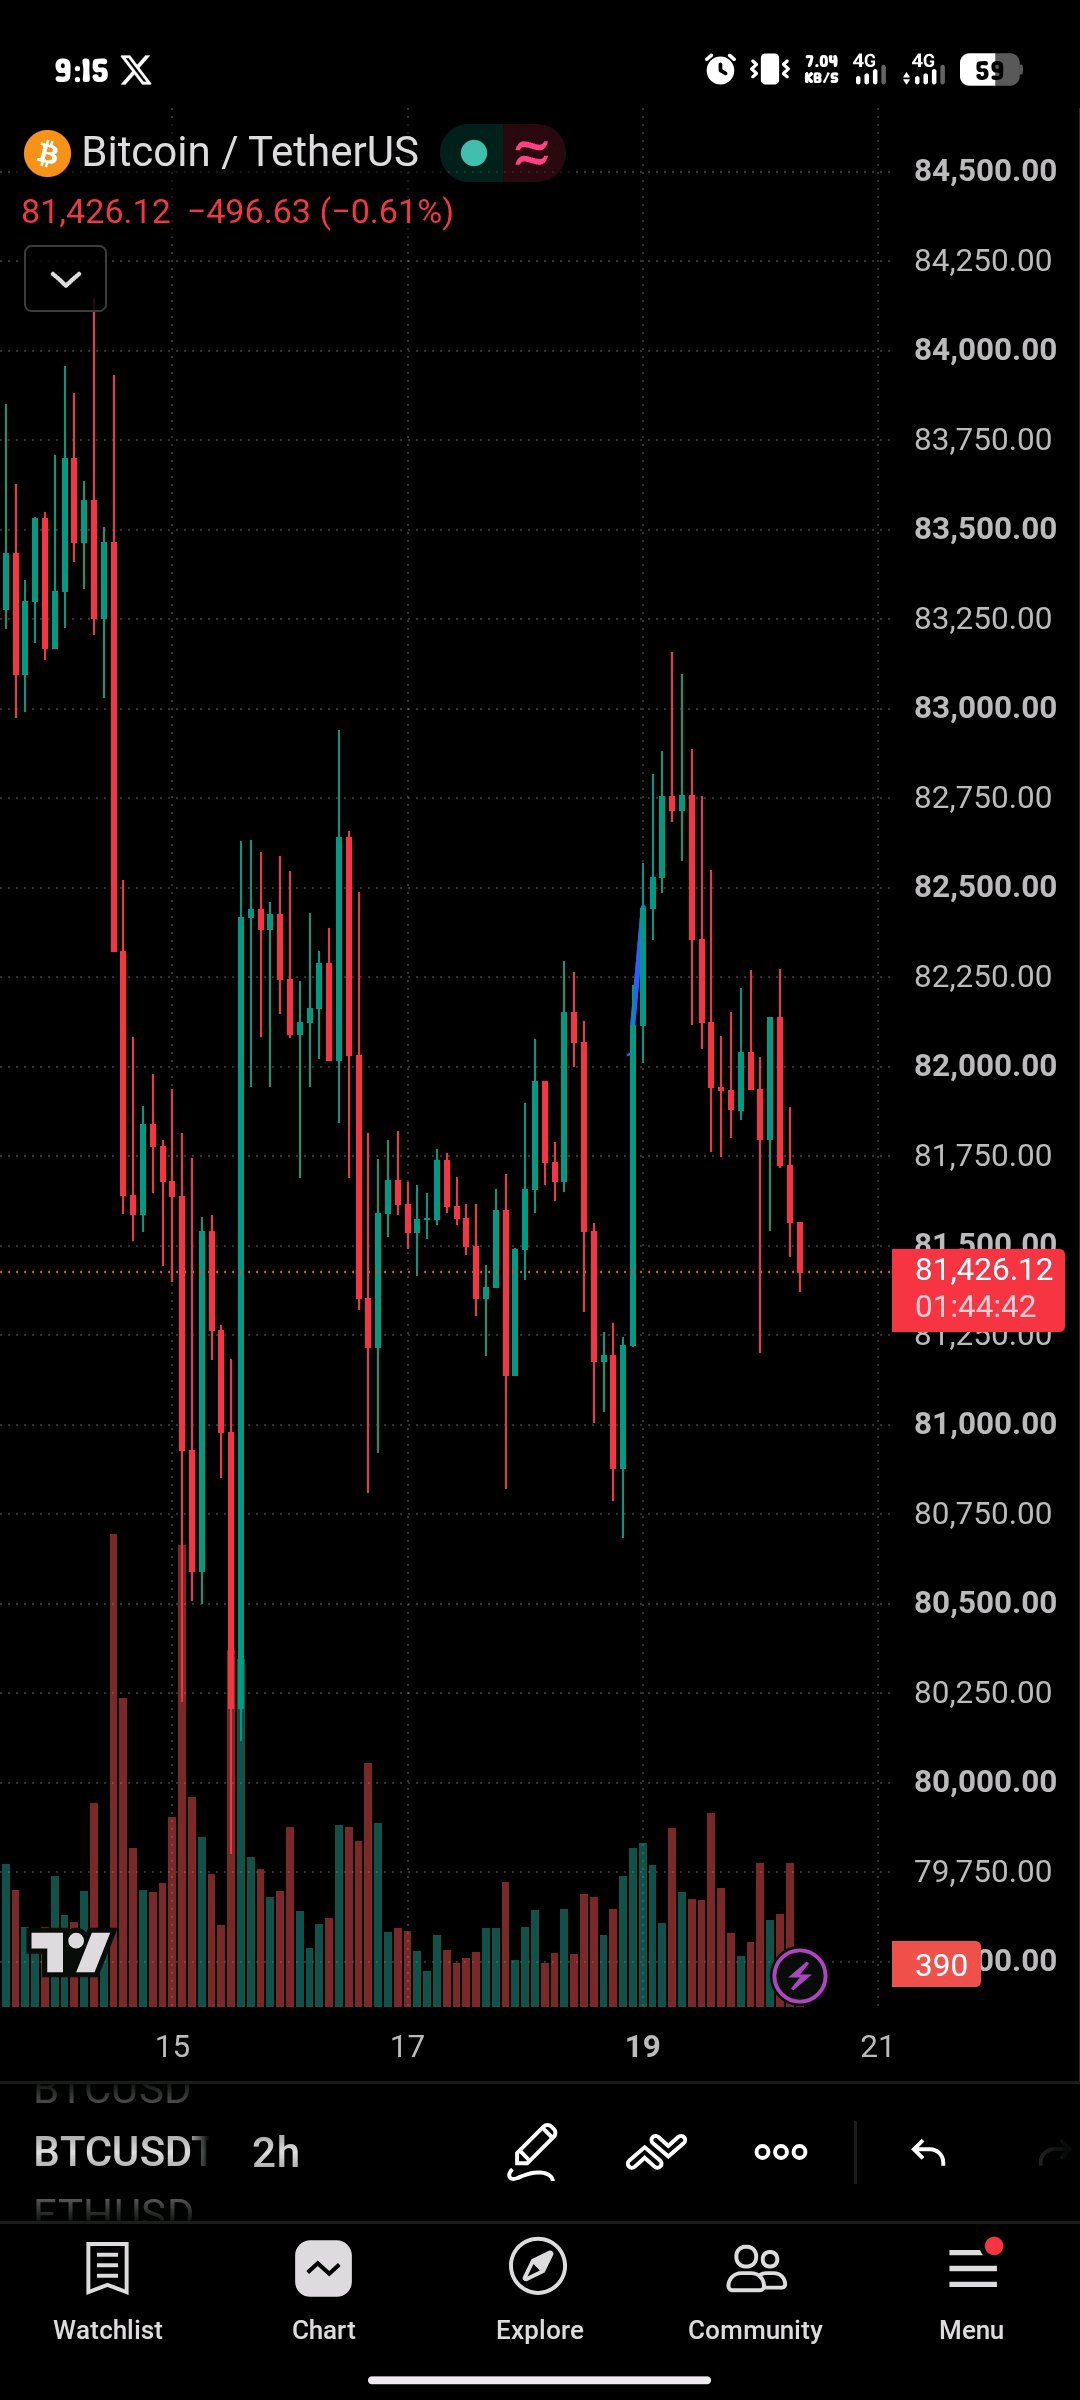
🚨 $BTC: THE NEXT BIG MOVE IS COMING!
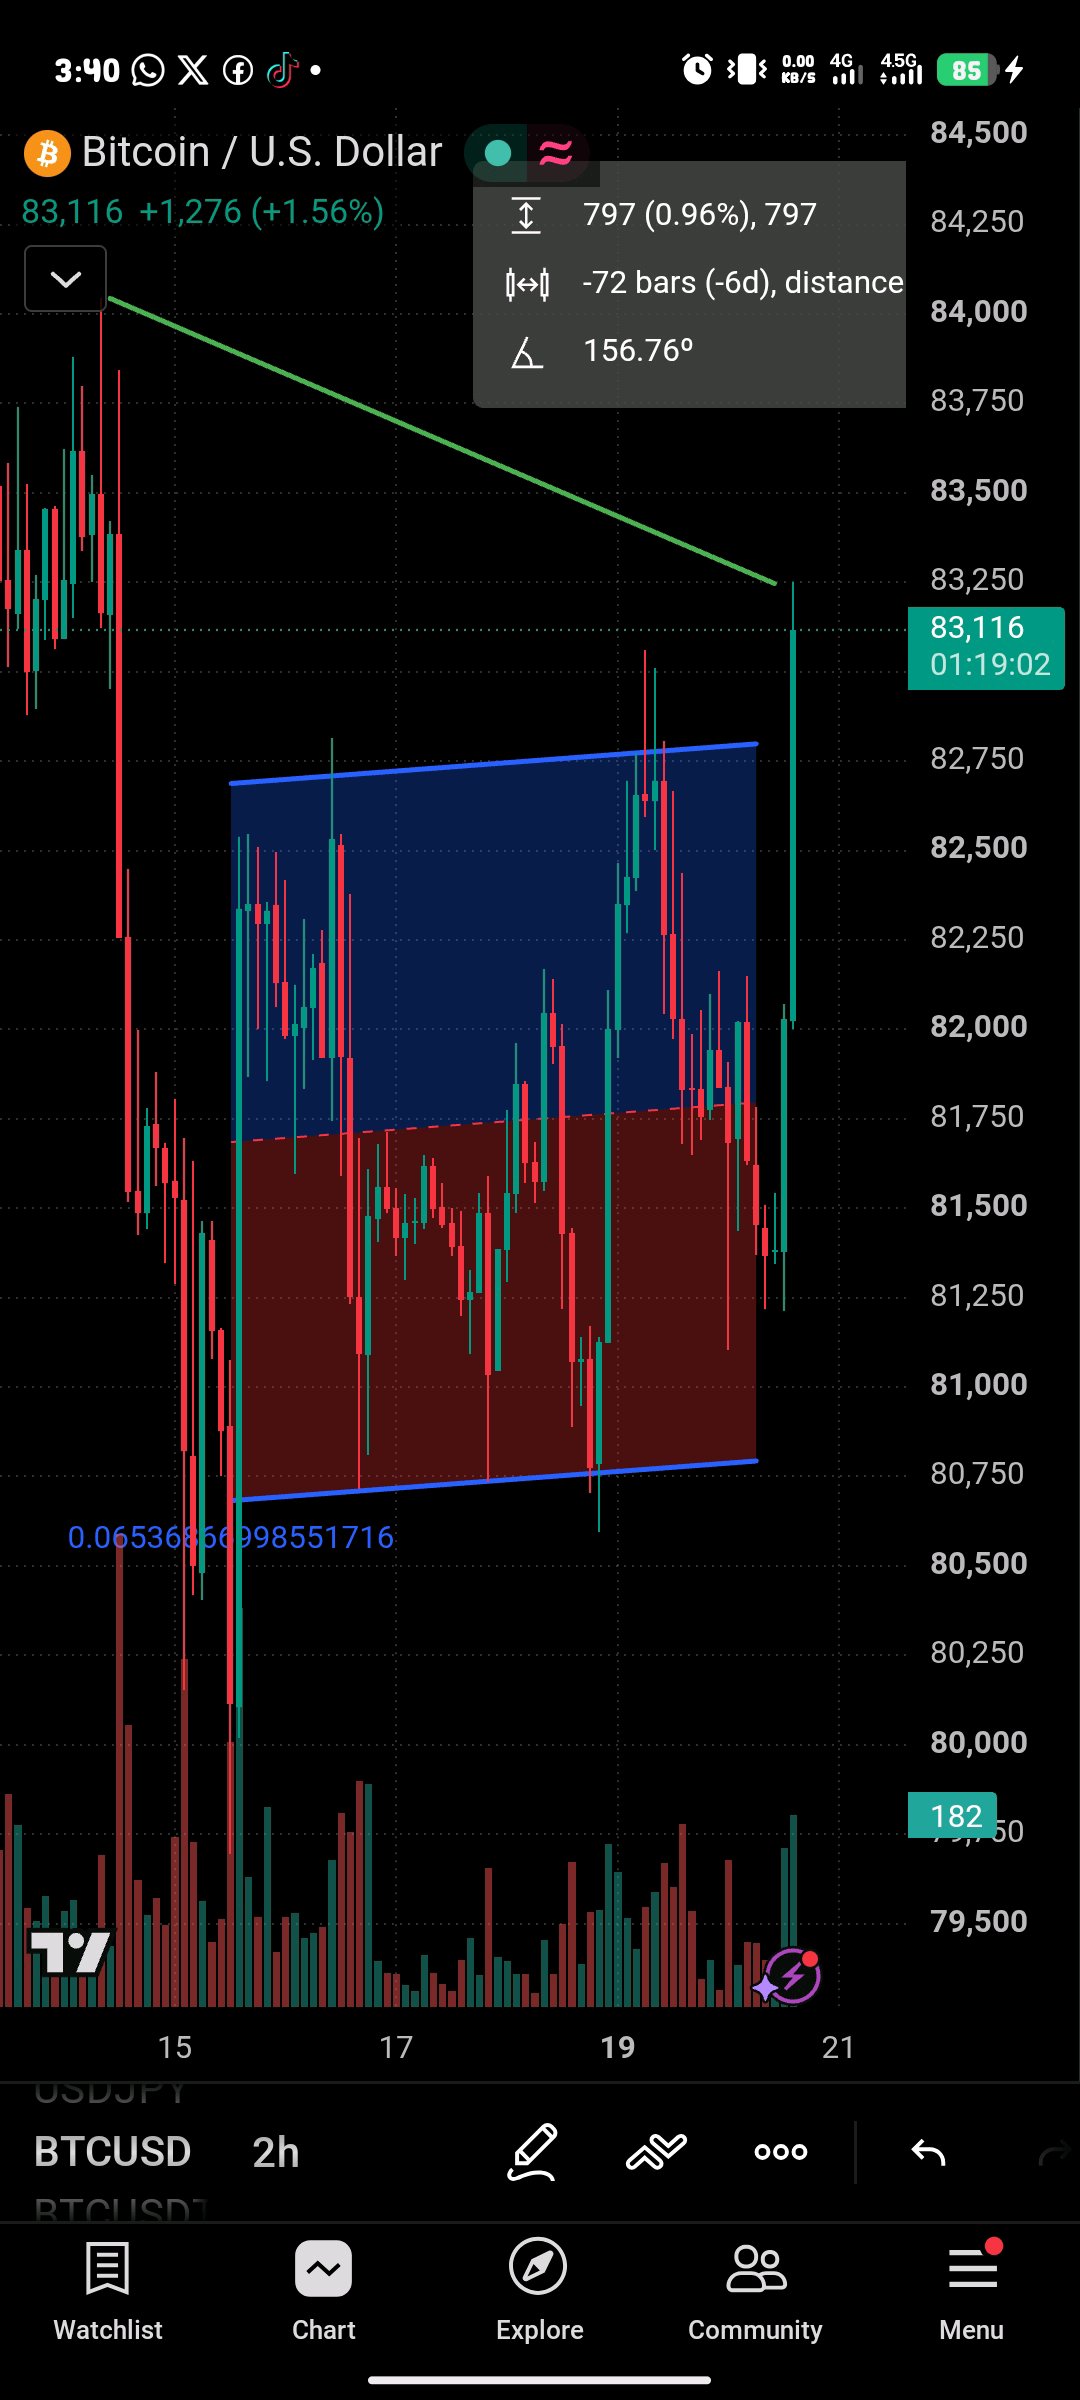
Bitcoin is hovering around $81,500–$82,000, and the market is approaching a critical decision point. After two weeks of pressure, BTC is trying to stabilize, but the recovery still faces major resistance. 🟢 BULLISH SCENARIO If BTC reclaims $83,200–$84,200 and holds above this zone, buyers could regain control. A successful breakout may open the door toward $85,000, followed by the $87,000 area. 🔴 BEARISH SCENARIO If Bitcoin fails to recover and loses the $81,000 support area, selling pressure could push the price toward $80,000. A breakdown below that level could expose BTC to further downside. 🎯 MY TAKE Bitcoin is at a critical point. Recent ETF outflows and uncertainty across financial markets are weighing on sentiment, while buyers are attempting to defend support. For now, I’m watching $84,200 for a bullish confirmation and $80,000 for a potential breakdown. Neither scenario is confirmed yet. Bitcoin’s next move could set the tone for the entire altcoin market. 🔥 Do you think BTC will reclaim $84K or drop toward $80K first? #ByXIMPACT #USCPI #MyByXTake #MakeYourMove $BTCUSDT
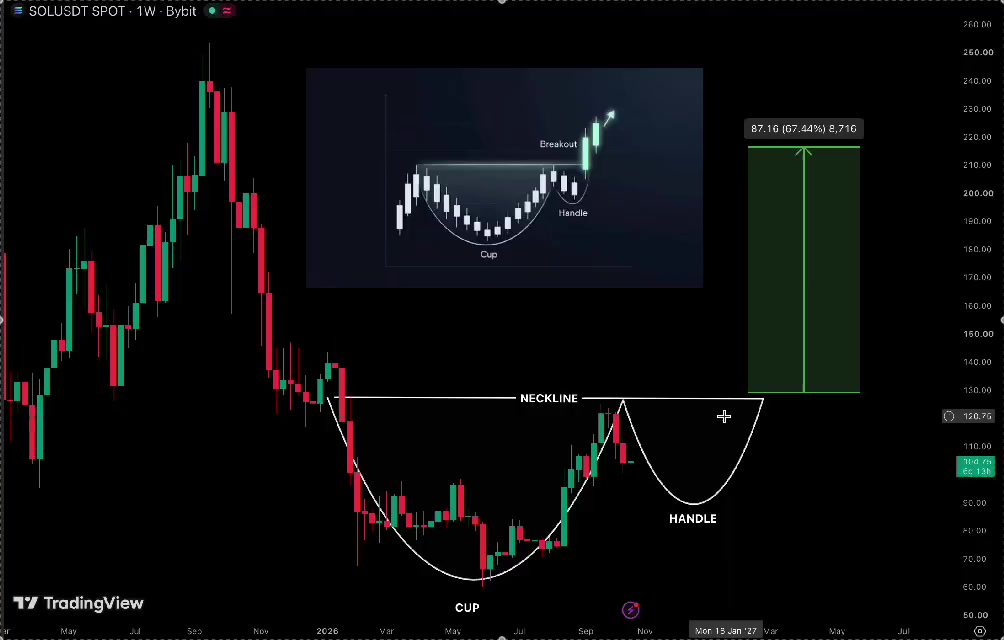
Solana going out from bleeding out to building a potential cup and handle on the weekly time frame $125–$130 is the level to flip tbh If $SOL breaks and holds above it, the chart opens up towards $215–$220 bears had their fun, now let’s see who gets squeezed next $SOLUSDT #ByXIMPACT #BybitStocks #TOKEN2049
🚨 $TSLA: A BIG MOVE IS COMING! 🚀
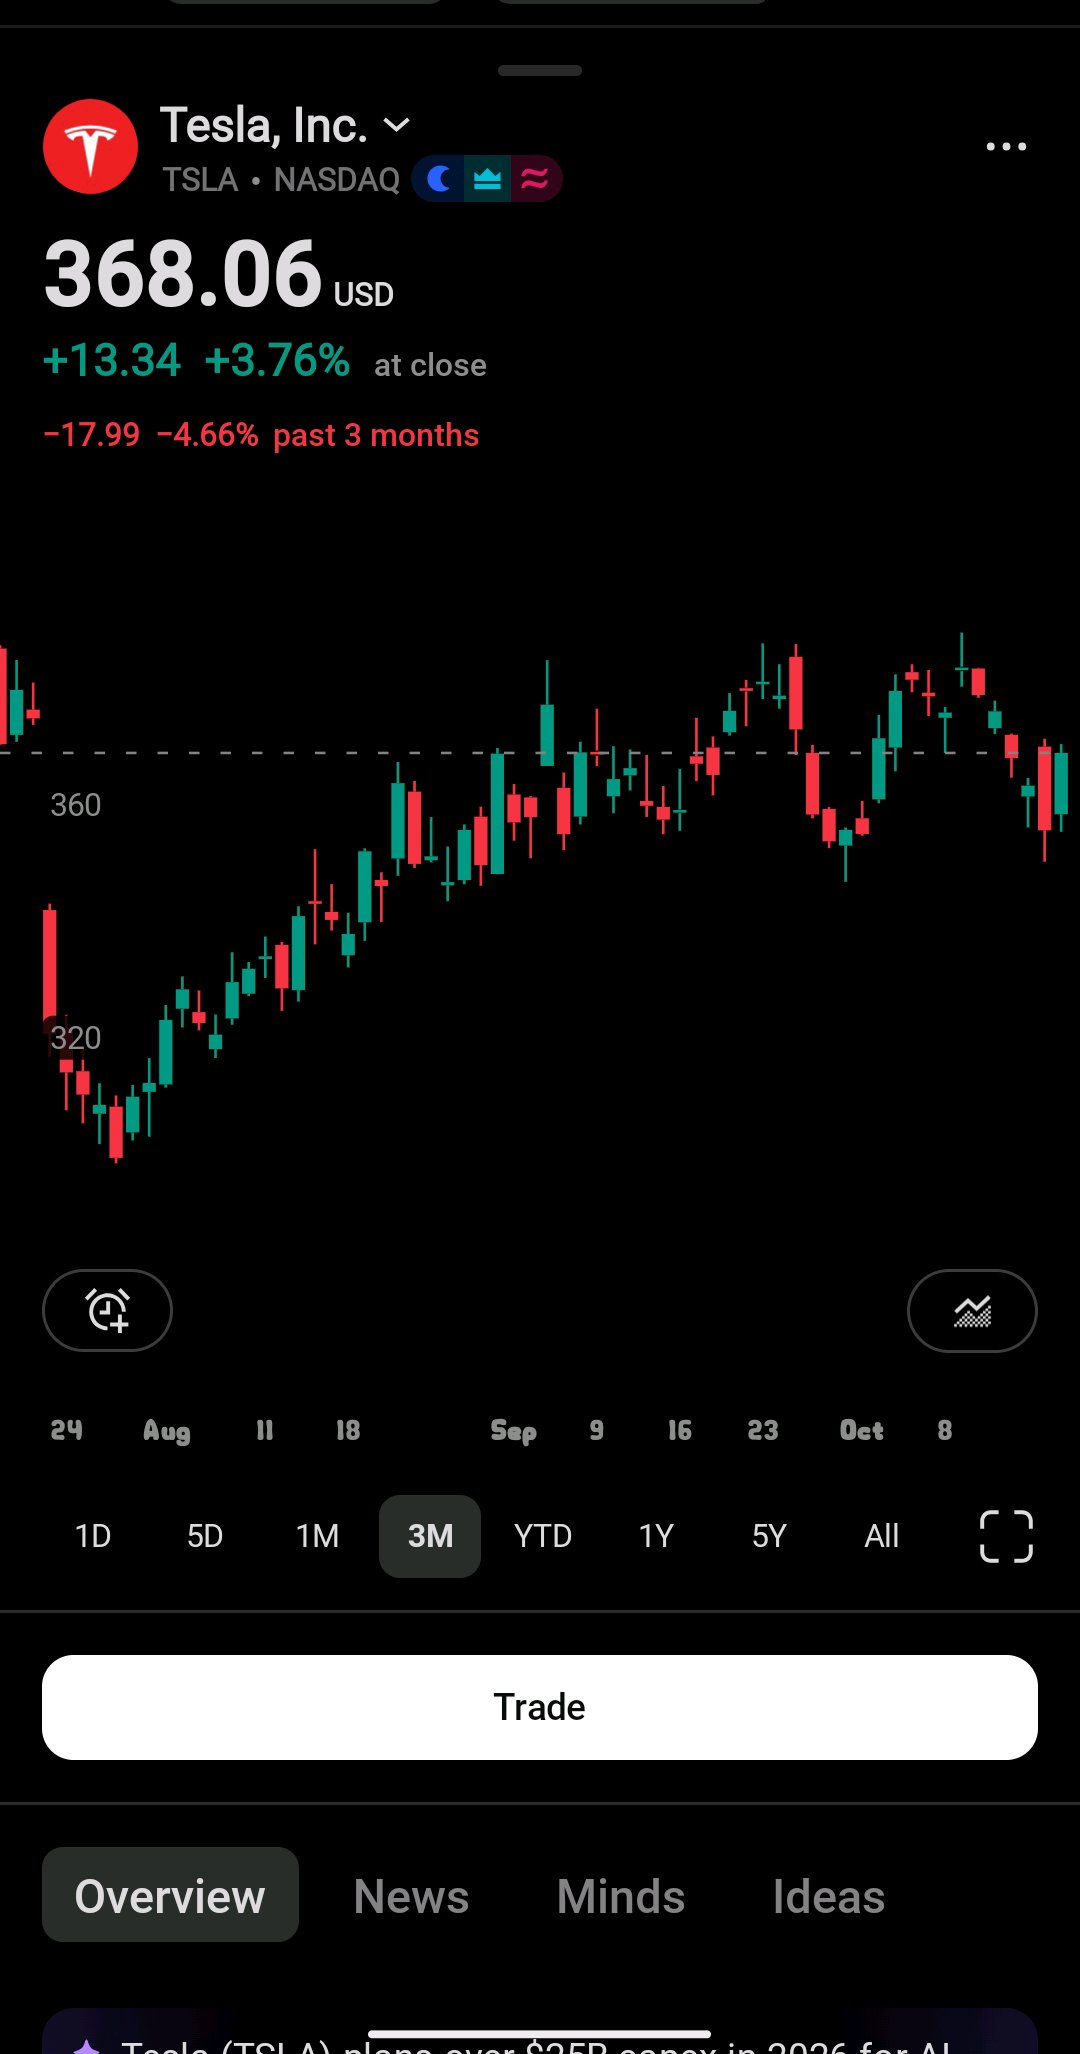
Tesla is approaching a major catalyst as investors prepare for its Q3 2026 earnings report, scheduled for October 21. The market is watching closely to see whether stronger vehicle deliveries can translate into better profitability. According to recent reports, Tesla delivered 486,532 vehicles in Q3, exceeding analysts’ expectations. However, profit margins, cash flow, and rising AI investment remain important concerns. 🟢 BULLISH SCENARIO If Tesla delivers stronger-than-expected earnings and provides positive updates on robotaxis, AI, and the Optimus robot, investor confidence could improve and support further upside. 🔴 BEARISH SCENARIO If earnings disappoint or management raises concerns about costs and profitability, selling pressure could return. Heavy investment spending may also keep investors cautious. 🎯 MY TAKE Tesla’s next major move may depend on its earnings results and forward guidance. Its AI and autonomous-driving ambitions offer long-term potential, but execution and profitability remain critical. I would watch the market’s reaction after the earnings release rather than assume the report will automatically push the stock higher. The key question: Can Tesla turn its ambitious technology plans into sustainable profits? Are you bullish or bearish on $TSLA heading into earnings? #ByXIMPACT #BybitStocks #TOKEN2049 #TSLATookOffLiterally #TSLAtooktothemoon $ETHUSDT $TSLAXUSDT
🇨🇳 China’s Growth: Bullish or Bearish for Crypto?
China’s economy grew by 4.5% year-on-year in Q3 2026, beating market expectations of 4.4%. Strong exports helped support growth, although weak domestic demand remains a concern. But here’s the important part for the crypto market: China’s support for blockchain technology does not mean it has legalized Bitcoin trading. China continues to restrict cryptocurrency-related financial activities while pushing forward with state-controlled digital infrastructure. 📈 BULLISH SCENARIO If stronger Chinese economic activity improves global investor confidence and encourages demand for risk assets, Bitcoin and the broader crypto market could benefit from improved sentiment. 📉 BEARISH SCENARIO If domestic demand remains weak or economic concerns trigger a risk-off move, investors could become more cautious, putting pressure on Bitcoin and altcoins. 🎯 MY TAKE China’s economic growth is worth watching, but it is not an automatic bullish signal for crypto. The key factors are global liquidity, investor sentiment, Bitcoin’s price action, and whether China changes its cryptocurrency restrictions. Remember: blockchain adoption and Bitcoin legalization are two different things. 🔥 Do you think China will eventually open its doors to cryptocurrency, or will it continue focusing on state-controlled digital technology? $BTCUSDT $SOLUSDT #ByXIMPACT #TOKEN2049 #USCPI

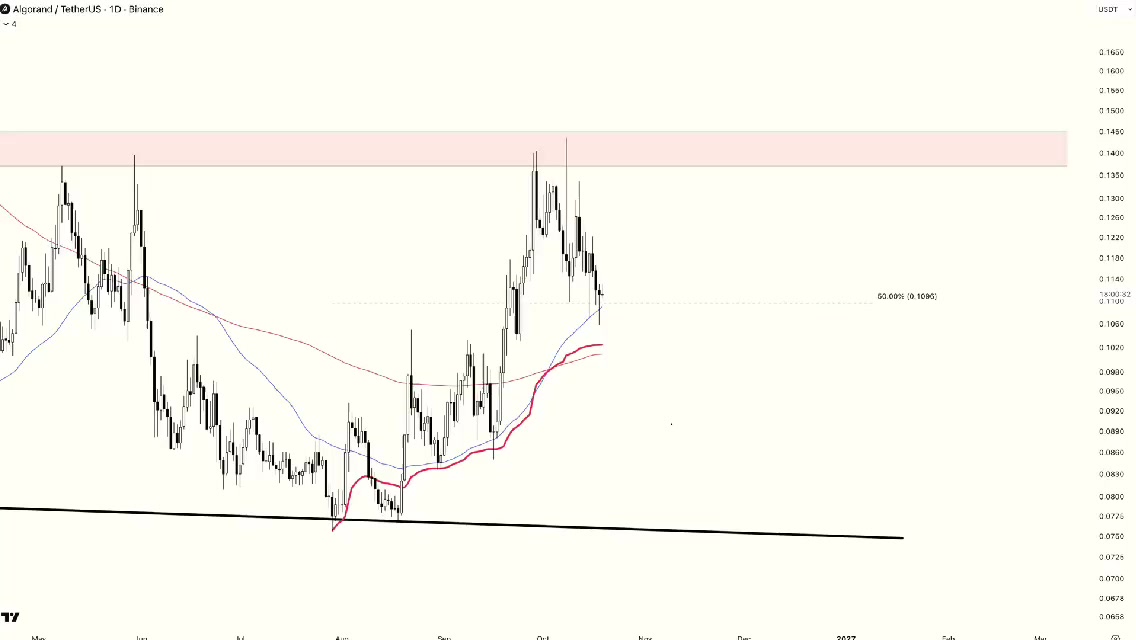
🚨 $ALGO IS AT A LEVEL THAT DETERMINES EVERYTHING THIS BULL RUN $ALGOUSDT is one of the very few altcoins I bother looking at... and it is at a very important support level. Algorand saw a 22% rebalance move towards equilibrium and 50 SMA. It is seemingly using both as a support level but if it fails to hold... The 200 SMA and Anchored VWAP become my next immediate support level. We need a strong move above the resistance level. #ByXIMPACT #USCPI #ByPickMakeYourPickCount #TOKEN2049