IBRAHIMcrypto
PRO CRYPTO TRADER / MENTOR CRYPTO GUY 💯 /NFTs lover🎨/GAMER💻🎮/🏋
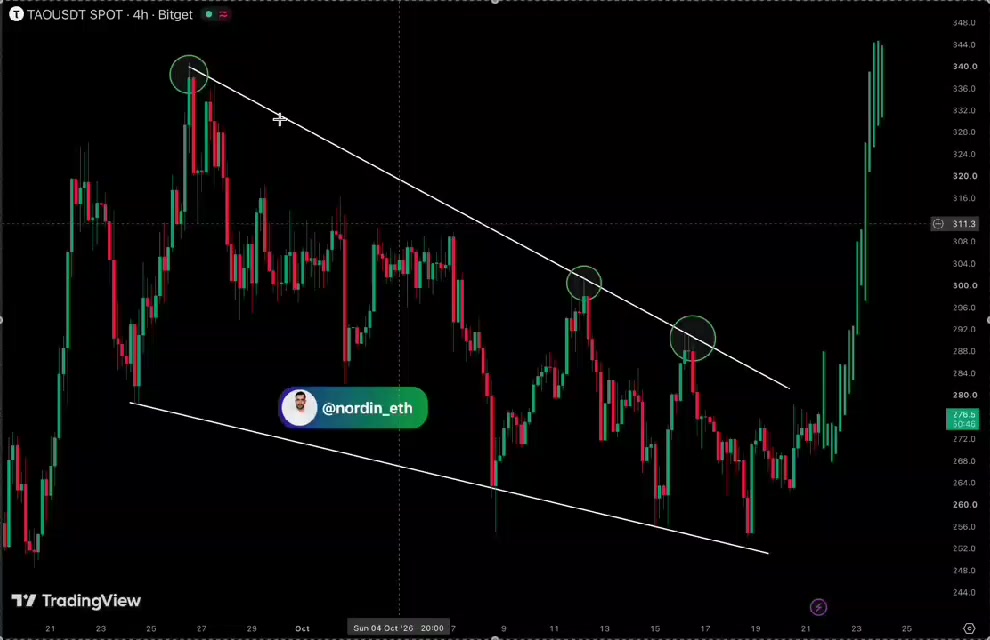
$TAO MOONSHOT LOADING ?
$TAO has been building frustration for weeks. Lower highs, repeated rejections, and now we're back near the breakout zone. What if this is the breakout that sends $TAO flying?. $BTCUSDT $BNBUSDT #MyByXTake @BybitX #MidtermsMarketWatch #ByXIMPACT
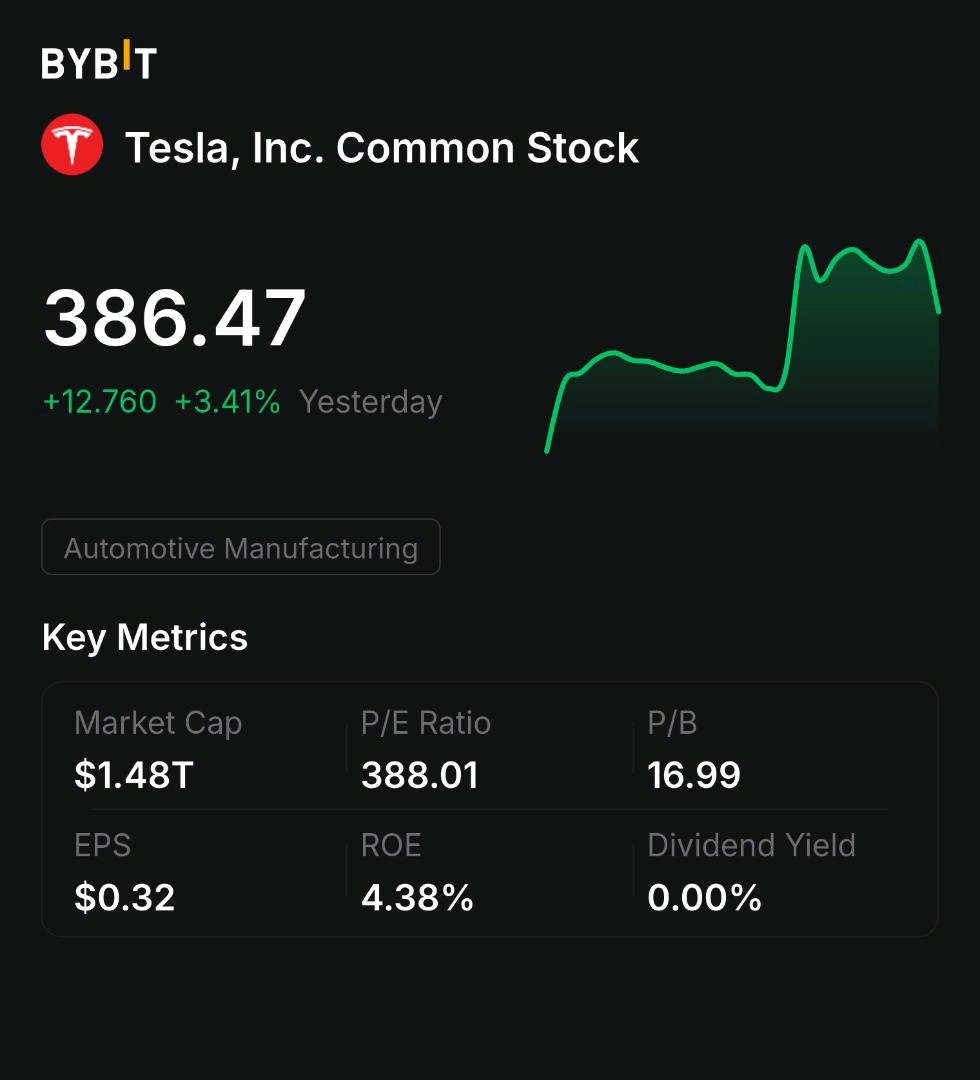
IMPRESSIVE FROM $TSLA 📈
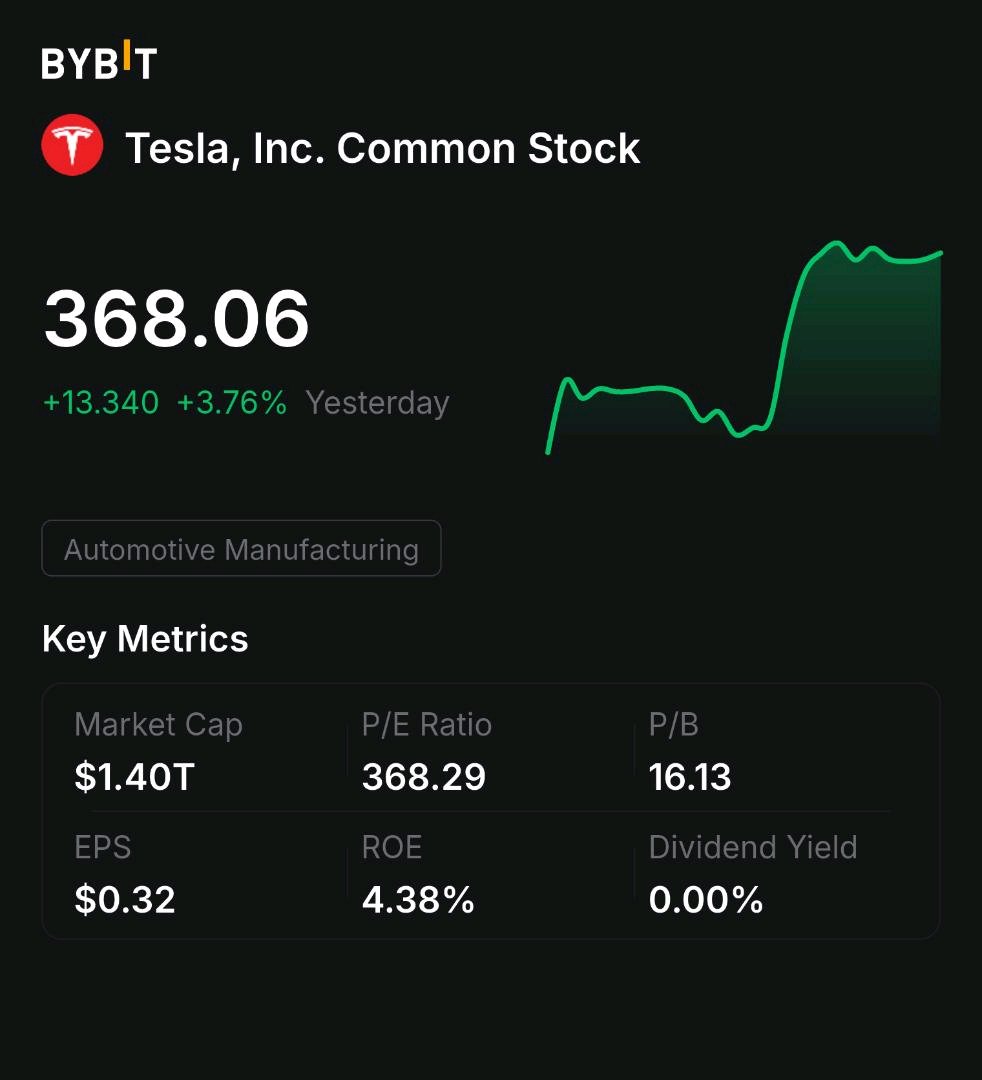
$TSLAXUSDT $TSLA reported a sharp 43% yearly drop in quarterly profit, despite stronger margins. Revenue came in slightly higher at $28.05 billion, over expectations of $27.9 Billion, but growth remains flat from a year ago. Net profit fell to $787 million from $1.37 billion last year. Adjusted EPS came in at $0.48, beating the $0.45 estimate but down 4% YoY. Tesla's gross margin improved to 19.6% from 16.8% last quarter, even as overall profits remained under pressure. #MyByXTake @BybitX #ByXIMPACT #BybitStocks

📈 WOULD $TSLA TURN BULLISH?
$TSLAXUSDT After opening Friday near $369 on excitement surrounding the highly anticipated Roadster unveiling, $TSLAXUSDT reversed sharply alongside the broader market selloff, closing at $354.72, dangerously close to a critical technical level. The big question now: can $TSLAXUSDT defend $347.90, or is another major leg lower about to begin? $TSLAXUSDT triggered a long-term sell signal approximately three months ago after breaking below its nearly two-year rising channel, whose lower boundary now stands at $401.45. Despite subsequent rallies and several weeks of sideways consolidation, the bearish structure remains unchanged. The $396–$401 region continues to represent major overhead resistance and a potential selling opportunity on upward retracements. Unless $TSLAXUSDT closes above $401.45, the longer-term downside targets remain $273.64 and potentially $229.80 over the coming months, with those support formations converging around February 2027. Friday's sharp reversal brought $TSLAXUSDT dangerously close to $347.90, the most important immediate support level. As long as $347.90 holds, a short-term rebound remains possible. The first key resistance is $368.53, a channel boundary that Tesla briefly reclaimed Friday before collapsing back below it. A daily close above $368.53 would generate a short-term bullish signal, potentially establishing a weekly low and opening the door to a recovery toward the upper $380s and lower $390s within one to two weeks. $370.57 represents an additional aggressive upside pivot, although a close above $368.53 would already be sufficient. But even a rally toward $390 would remain a countertrend move within the larger bearish structure. A daily close below $347.90 would trigger a fresh downside SELL SIGNAL and significantly reduce the likelihood of revisiting the $390s anytime soon. The downside roadmap: – $347.90 — critical support and bearish trigger – $332.21 — initial downside target, based on a 5/8 Fibonacci retracement, potentially as soon as the following session – $306.22 — next major downside objective within two to three weeks – $273.64 — longer-term target over the next two to three months – $229.80 — deeper structural support target into early 2027 What would turn $TSLAXUSDT bullish? Only a confirmed close above $401.45 would reverse the long-term bearish signal. That could open the door to a substantial advance toward $554.20, the upper boundary of Tesla's six-year channel, potentially by the end of Q1 2027. So, Tesla's Roadster-driven rally has failed, and the stock remains technically vulnerable. Above $347.90, a rebound toward $368.53 and potentially $390 remains possible. Below $347.90, the next major sell signal activates, putting $332 and $306 in focus. The long-term trend remains bearish until $401.45 is reclaimed. Watch $347.90 today. The next decisive move could set the tone for Tesla over the coming weeks. #TSLATookOffLiterally #TSLAtooktothemoon #ByXIMPACT
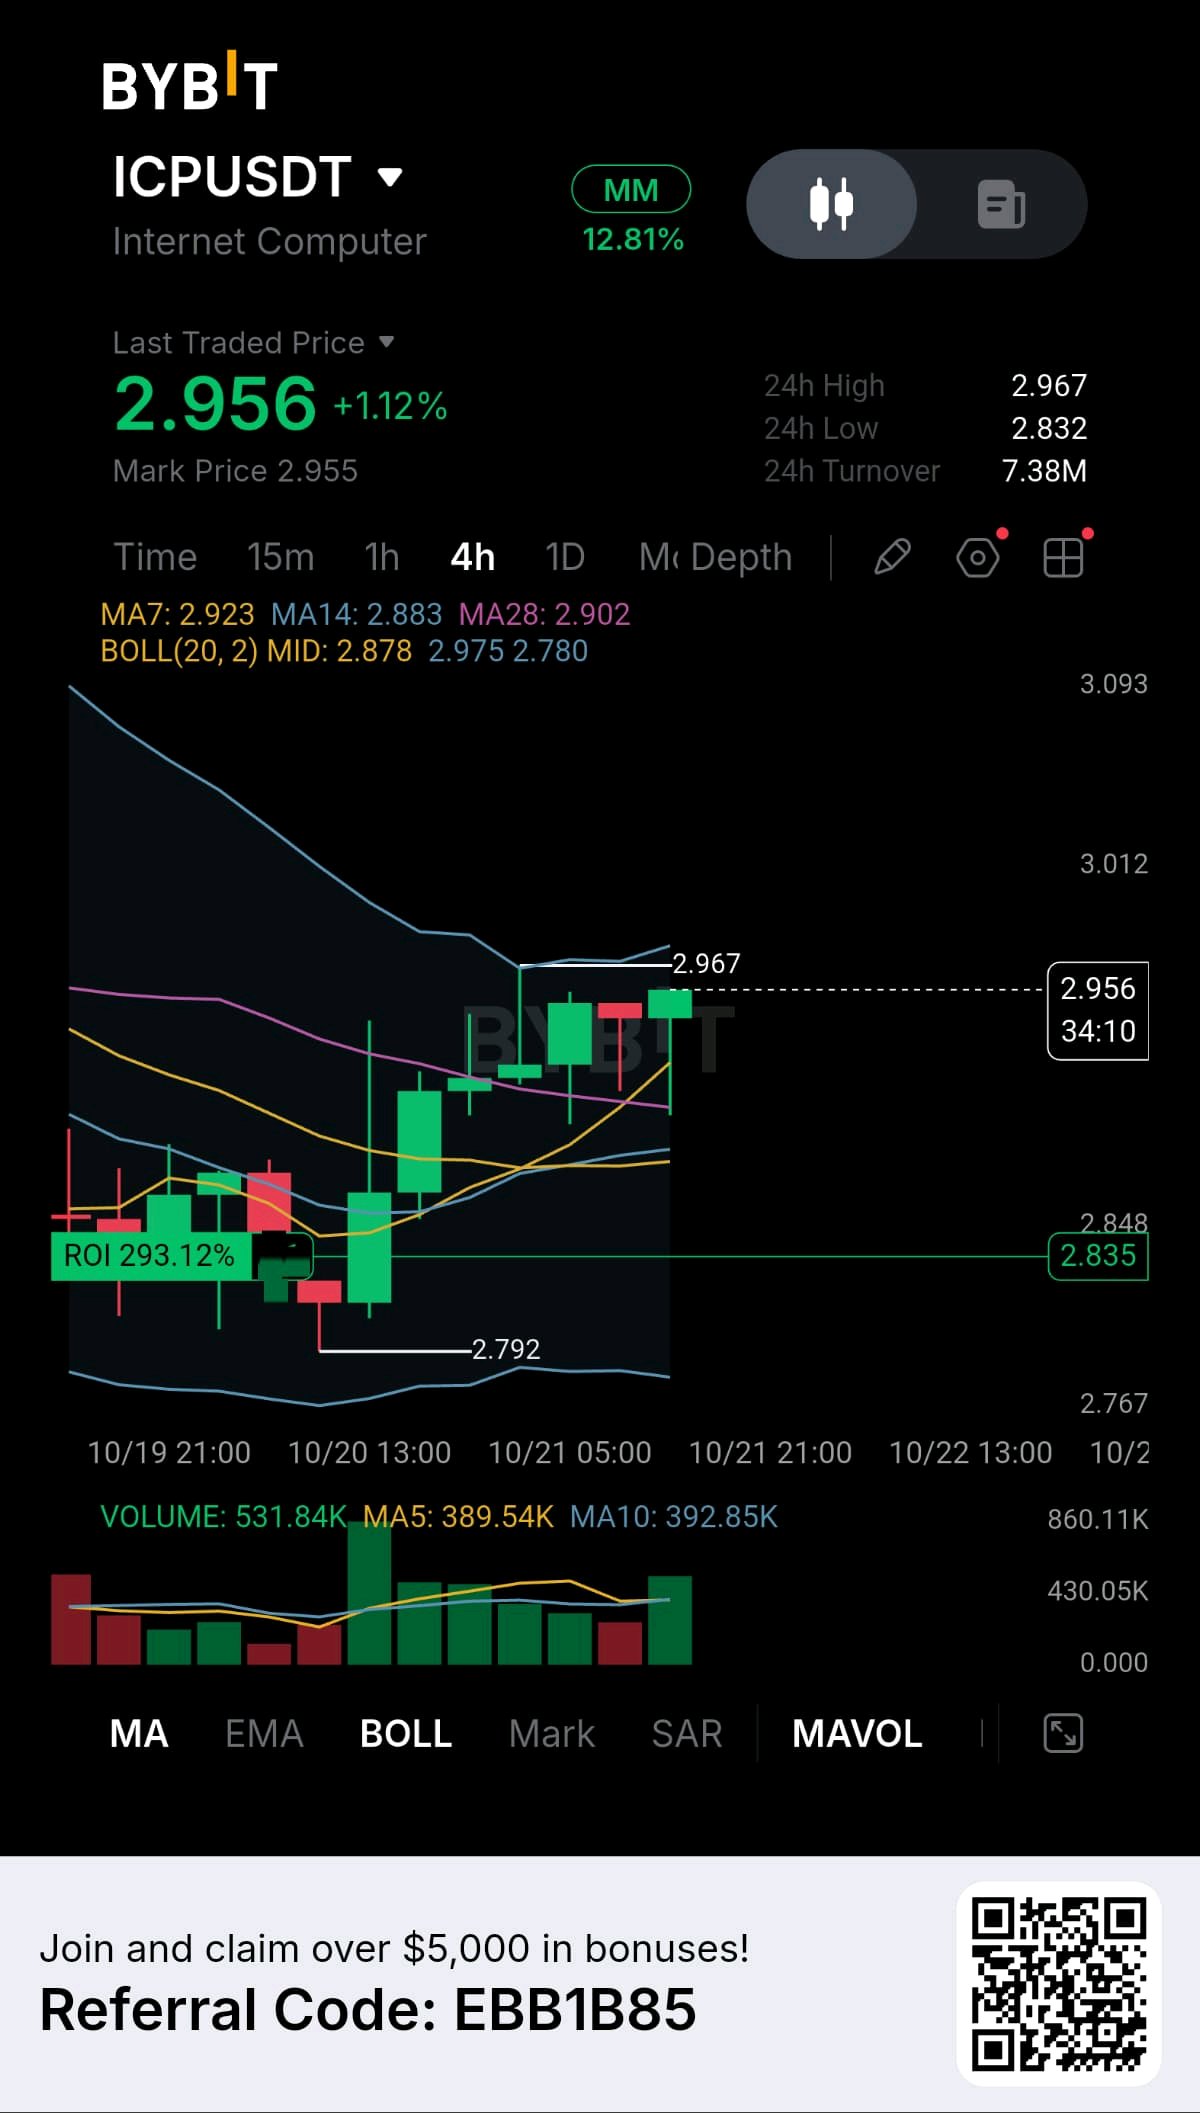
$ICP RECOVERY IN PROGRESS 📈👀
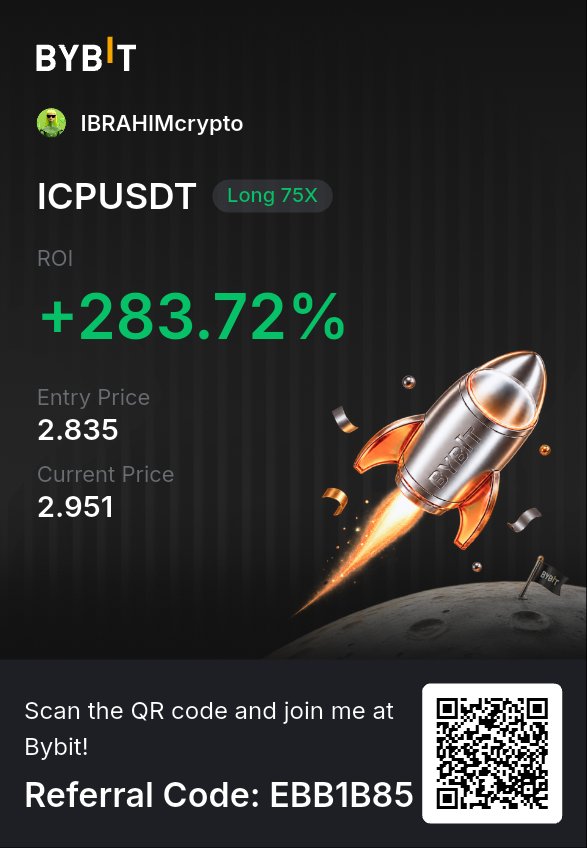
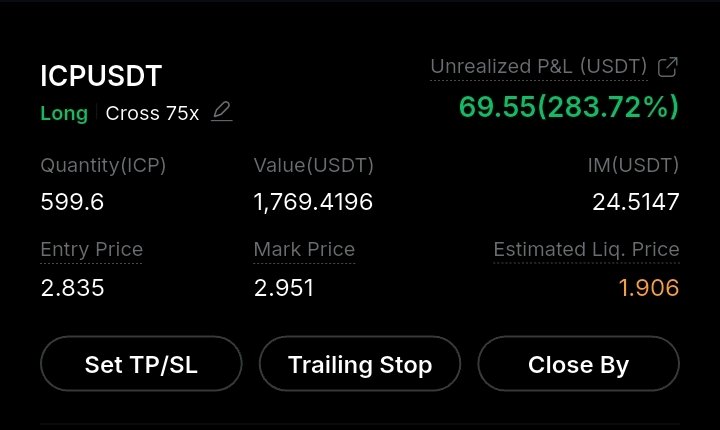
Is $ICPUSDT Internet Computer preparing for a breakout or approaching a resistance trap? $ICPUSDT is trading around 2.956 USDT on my 4H Bybit chart, up 1.12%. After dropping to 2.792, price staged a strong recovery and is now testing the 2.967 local high. This is where confirmation matters more than excitement. 🔍 1. MARKET STRUCTURE: RECOVERY IN PROGRESS The rebound from 2.792 shows buyers stepping back in after the decline. Recent candles are forming a stronger short-term structure, but price must break and sustain above 2.967 to establish a clearer bullish continuation. Until then, resistance remains active. 📈 2. MOVING AVERAGES: BULLISH SHORT-TERM ALIGNMENT • MA7: 2.923 • MA14: 2.883 • MA28: 2.902 Price is above all three moving averages, and MA7 is leading the other averages. This supports the recovery thesis. However, the MA14 remains below MA28, so the broader alignment is not perfectly bullish yet. I want to see sustained price acceptance above resistance rather than assume momentum will continue. 📊 3. BOLLINGER BANDS: MOMENTUM MEETS RESISTANCE The middle band is at 2.878, the upper band at 2.975, and the lower band at 2.780. Price is trading close to the upper band, showing strong recovery momentum but also approaching an area where price could stall or pull back. A convincing close above 2.975, followed by a successful retest, would strengthen the breakout case. Rejection around this zone could bring price back toward the middle band. 🔥 4. VOLUME: BUYERS ARE SHOWING INTEREST The displayed candle volume is approximately 531.84K, above the MA5 volume of 389.54K and MA10 of 392.85K. That suggests increased participation in the latest move. The next question is whether buying volume can sustain a breakout, rather than simply accompany a short-term bounce. 🎯 5. KEY LEVELS I'M WATCHING • 2.967–2.975: Immediate resistance and breakout confirmation zone. • 2.923: MA7; first short-term support reference. • 2.902–2.883: MA28 and MA14 support area. • 2.878: Bollinger middle band; important recovery reference. • 2.835–2.792: Lower support zone if the recovery weakens. MY BIAS: Cautiously bullish while price holds above the moving-average cluster, but I would not call a confirmed breakout until resistance is cleared and defended. A rejection followed by a break below support would weaken the bullish thesis. The lesson is simple: indicators provide context, but price confirmation decides whether the thesis is holding up. 🤝 YOUR VIEW: Would you wait for a confirmed 4H close above 2.975 before looking for bullish continuation, or do you see enough evidence to support the recovery already? Share your reasoning below. Let's discuss the chart, not just the direction. #MyByXTake #ByXIMPACT
SpaceXQ3 REVENUE SURGED 161% 📈
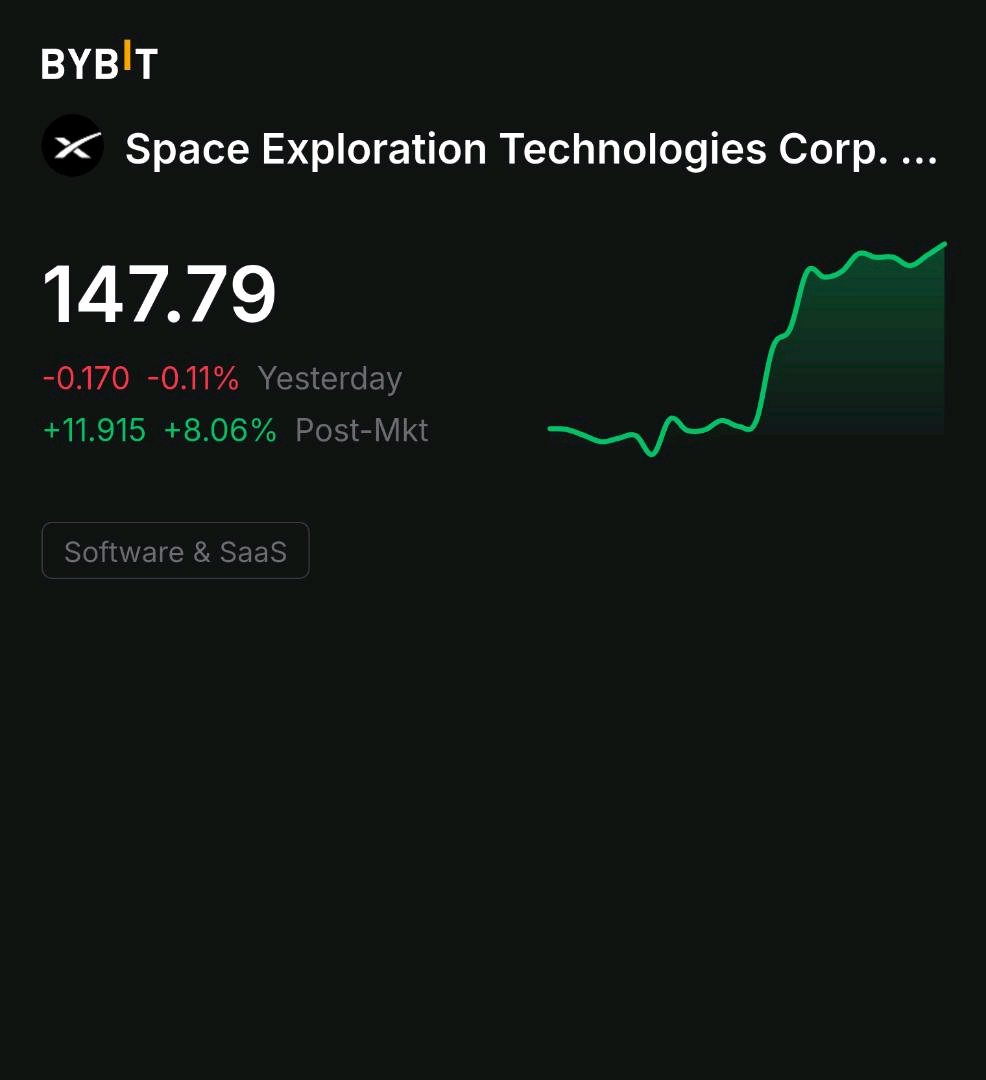
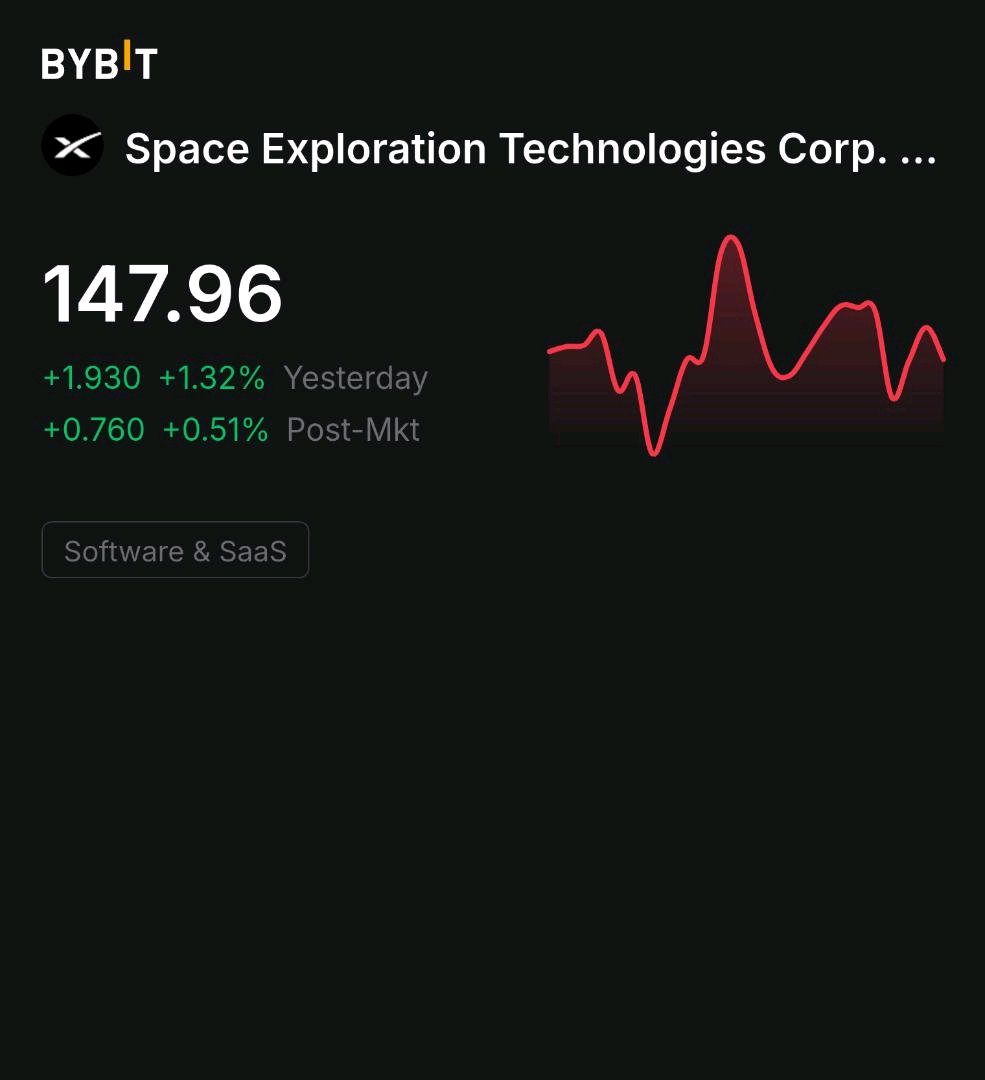
SpaceX reported Q3 revenue of $14.575B, up 161% YoY, and net profit of $4.404B, reversing a year-earlier loss. AI revenue surged 830% to $7.560B, surpassing the $5.248B connectivity segment, which includes Starlink, as its largest revenue source. Starlink consumer subscribers reached 13.6M; connectivity revenue rose 69%. Starship completed its first revenue-generating mission, deploying 26 V3 satellites. AI compute and satellite internet growth drove improved results. AI business becomes the main growth driver The boss has something to say SpaceX's Q3 financial report is indeed explosive. Revenue reached $14.575 billion, a year-on-year increase of 161%, with a net profit of $4.404 billion, turning losses into profits directly. The most impressive is the AI business, with revenue of $7.56 billion, soaring 830% year-on-year, surpassing the Starlink connectivity business's $5.248 billion, becoming the largest source of income. The market is also responding positively, with $SPCXXUSDT and xSPCX both rising nearly 1% today. I believe this financial report completely changes the valuation logic of SpaceX. Previously, everyone saw it as a rocket manufacturer and satellite broadband provider, but now it is essentially an AI computing power giant disguised in aerospace. With AI computing power combined with Starlink users growing to 13.6 million, it is advancing on two fronts, and the performance improvement is very clear. Some comments say the AI business is rewriting SpaceX's growth story, and that is not wrong. For crypto, SpaceX continues to attract capital, with funds staying in leading tech companies, so liquidity for $BTCUSDT is unlikely to increase in the short term. But this is a long-term logic, not a short-term catalyst. $BTCUSDT has been fluctuating around 80,000 these past two days, with direction unclear before the FOMC. I am currently out of position, neither chasing the rise nor cutting losses. The strategy is still to see if the 80,000 level can hold; if it breaks, expect a deeper pullback, with resistance above at 84,000 to 85,000. Wait for data and meetings to conclude, and set stop-loss orders properly. The above analysis is time-sensitive; orders must have stop-losses set. Good luck. #MyByXTake @BybitX #ByXIMPACT #BybitStocks

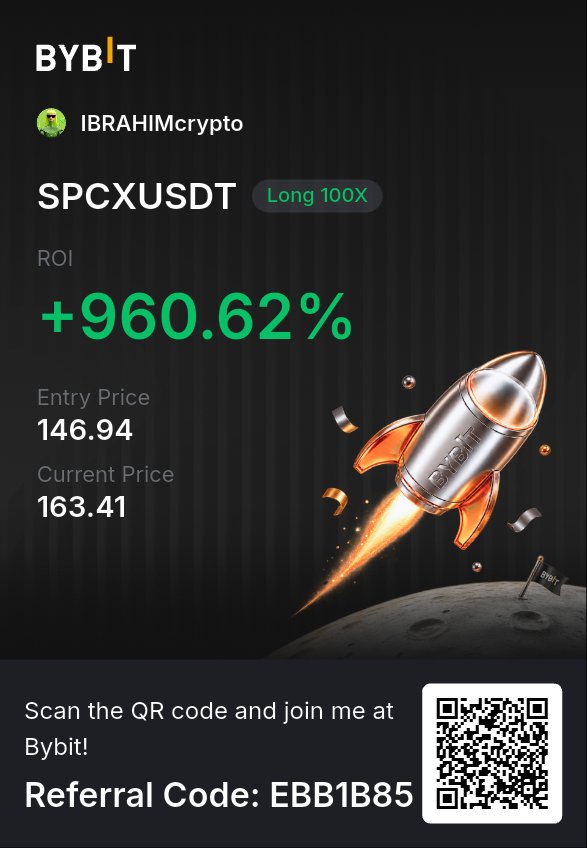
🚨$SPCX and $NFLX REPORT Q3 TOMORROW!
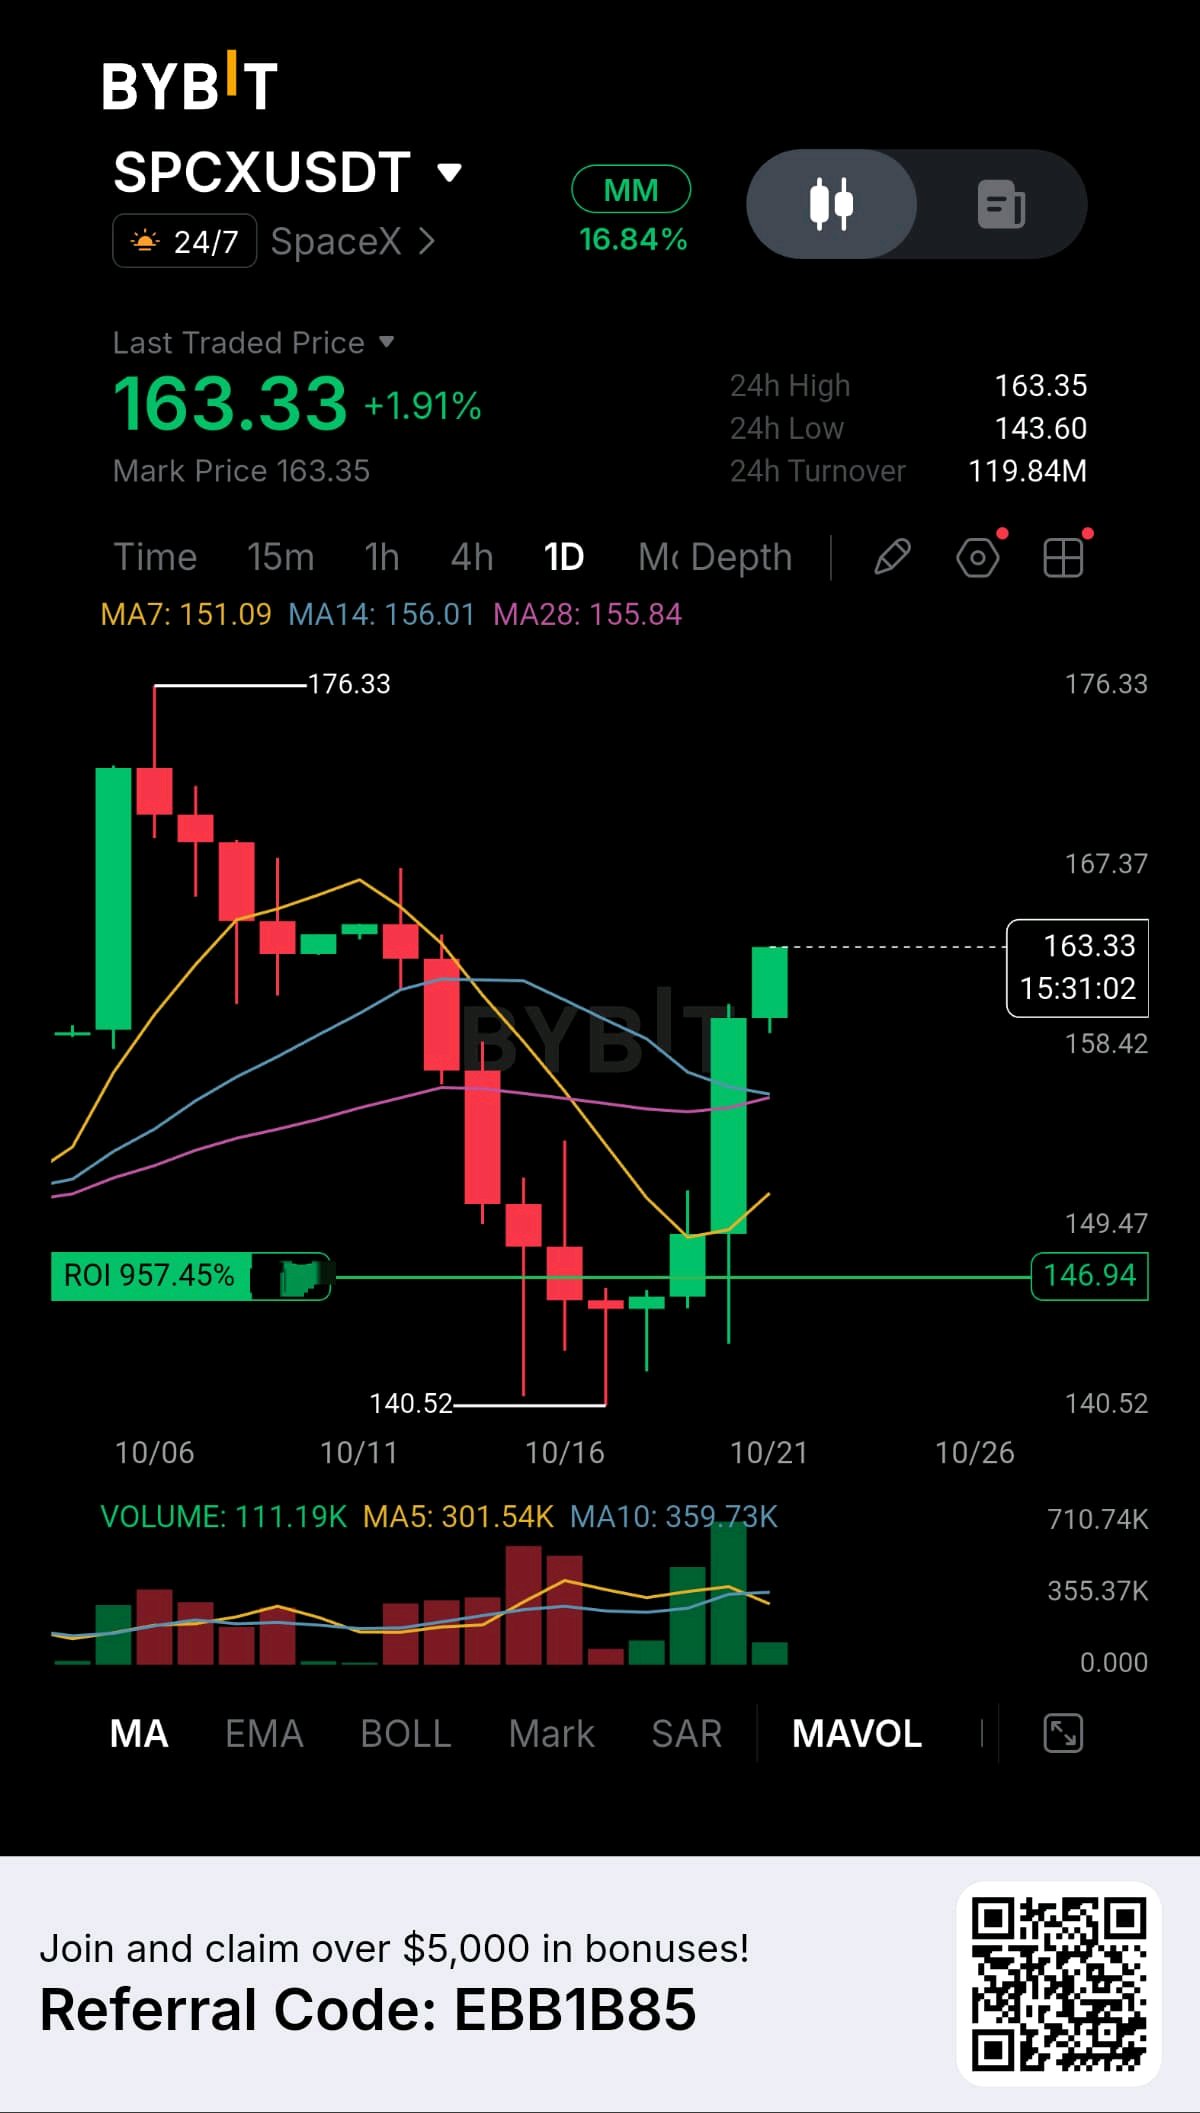
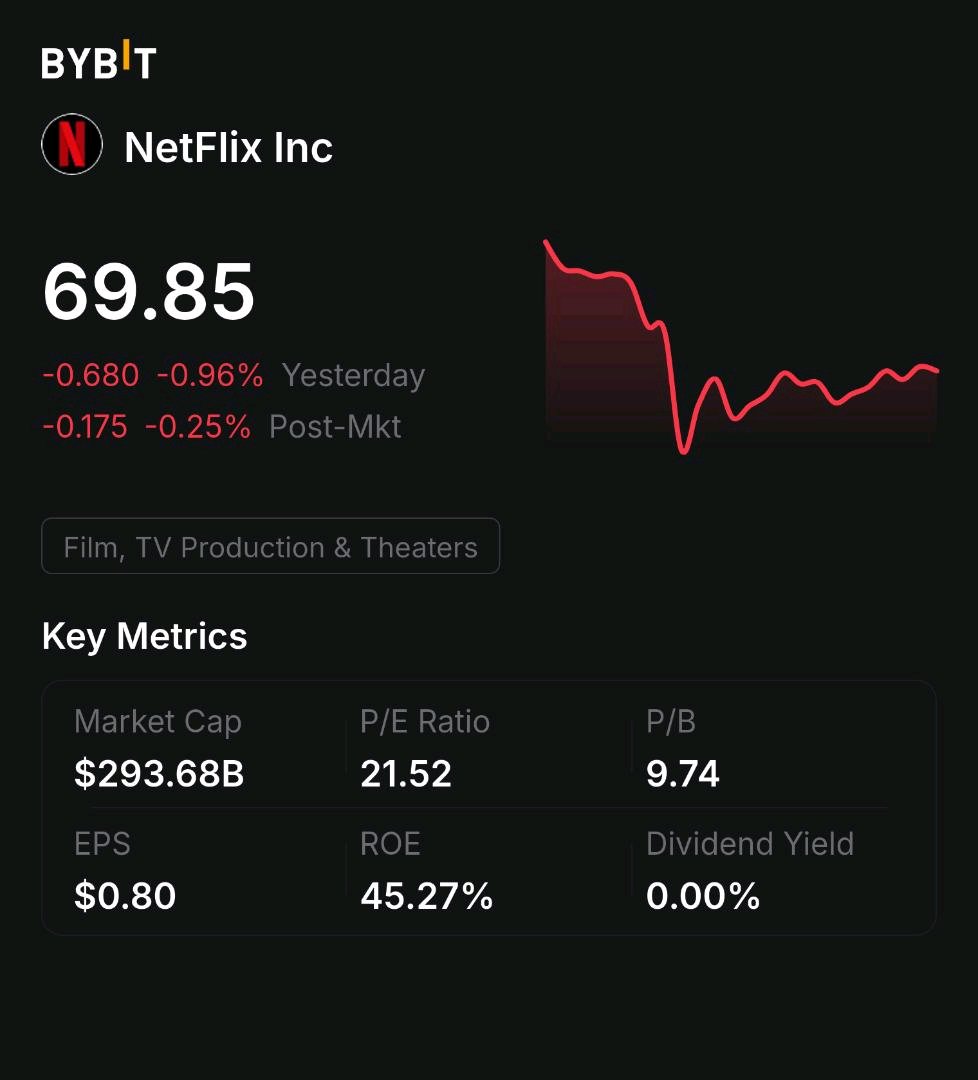
I'm just checking $SPCXXUSDT and NFLX before tomorrow's earnings, and here's my take on both setups. 📊 $SPCXXUSDT - $148.63 on my chart Price is right now at the $147.11 support level. First resistance is at $151.25, second is at $153.75. Break of the support would be bearish for price heading to $143 area, including possible retest of the $140.50 swing low. In case of $SPCXXUSDT, I'd rather see price break through resistance and wait for confirmation. $NFLX - around $69.85 on the last close Support should be monitored at the $69.17–$68.50 level, resistance is at $70.37-$70.90. Above it is the $71.57 level. In case of breakdown of the support, that would change the whole picture. Both stocks report after the close, and therefore the levels above should be considered as potential, not guarantee. Earnings invalidate a chart fast enough, and capital protection is more important than predicting a candle. But one thing that I've experienced as a trader your choice of a platform can be very limiting in some cases. Let's say you hold NFLX for a long term, but suddenly $BTCUSDT drops 10%. You see an opportunity but can't trade it due to capital being invested. The process of selling, getting settled, and transferring can take some time. When the money is transferred to your exchange, the moment might be missed already. And that's where I got interested in the concept of rToken. The ability to transfer eligible stock assets without having to sell them first allows you to combine your stocks and crypto assets under one trading umbrella. You shouldn't have to choose between long-term conviction and short-term opportunities just because your assets are kept at two different exchanges. Would like to know what stock holders do in such situations. Is everything kept separately or you'd rather manage your stocks, ETFs, and crypto from one account? #ByXIMPACT #BybitStocks
$META to move back towards record high?
Meta reports its Q3 2026 results on Wednesday, October 21, after the US market closes. $METAXUSDT has been on a tear since launching its Muse AI agent on September 8 - the stock is up 15.6% since that release. This stock has also climbed about 7.5% so far in 2026, yet remains about 10.2% below its highest ever close. The question for this week's earnings: is the AI spending paying off? Key Themes to Watch Advertising revenue - the engine: Any beat here would confirm AI is already boosting the core business. The capex debate: Zuckerberg said he is prepared to spend $100–200B on AI. Watch the Q4 capex guidance - and beyond - closely. Muse monetisation: Muse has reached 10.8 million cumulative downloads and held the #1 spot on the iOS App Store since September 28. Investors want a credible path to profitability. #MyByXTake #ByXIMPACT #BybitStocks
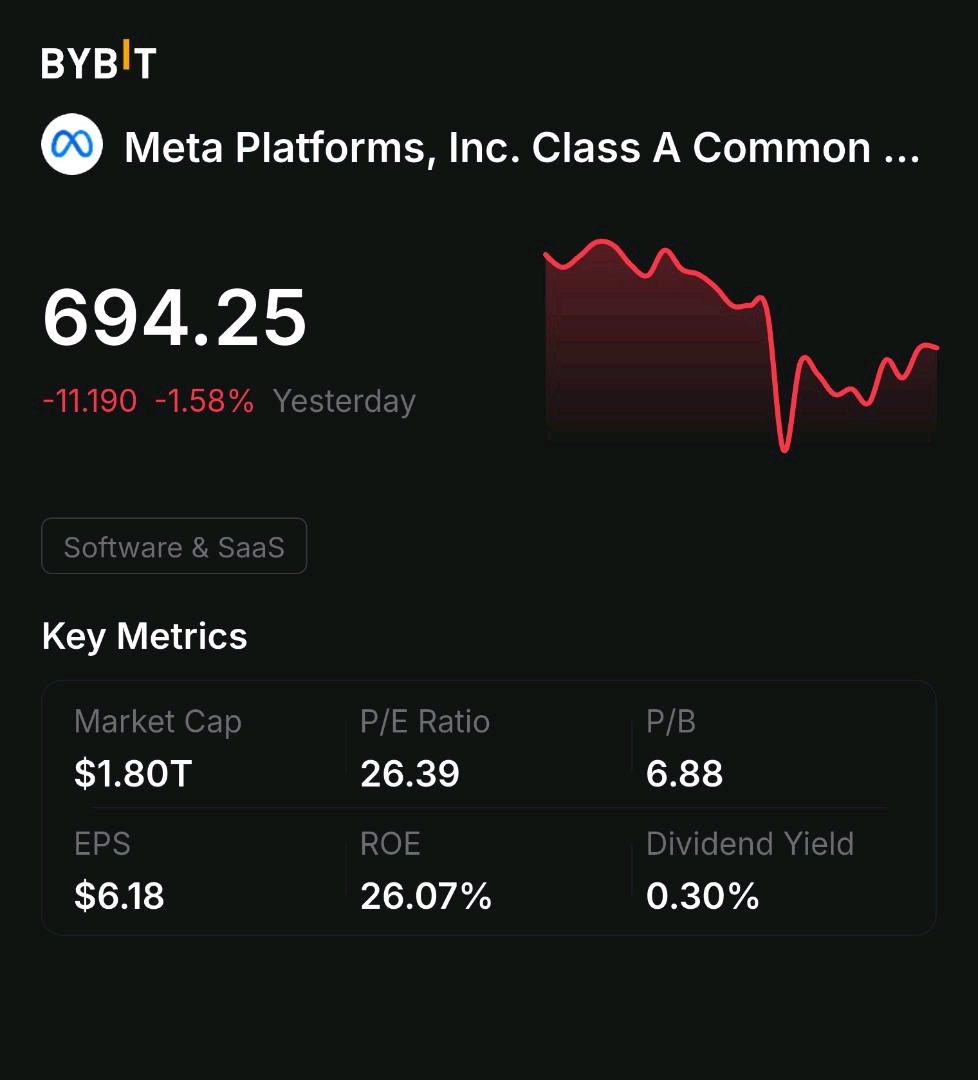


This Week's Earnings: SpaceX, Meta, Netflix, Tesla
US earnings season is heating up 🔥 Looking for a short-term trade/long-term investment in US stocks 👉 https://www.bybit.com/en/learn/market-pulse/4-stocks-to-watch-october-19-23-SpaceX-SPCX-Netflix-NFLX-META-Tesla-TSLA-earnings Tap link ☝️ for: ✅ Key earnings themes to watch this week ✅ Short-Term Forecasts: how the stock might react within 1 day of the earnings announcement (and potential guide for your "Take Profit" levels?) ✅ Long-Term Forecasts: how much Wall Street believes that stock could rise/fall over 12-months #BybitStocks #MarketPulse #TechEarnings #TradFiVsCrypto #StockEarningsSeason @BybitX $TSLAXUSDT $SPCXXUSDT
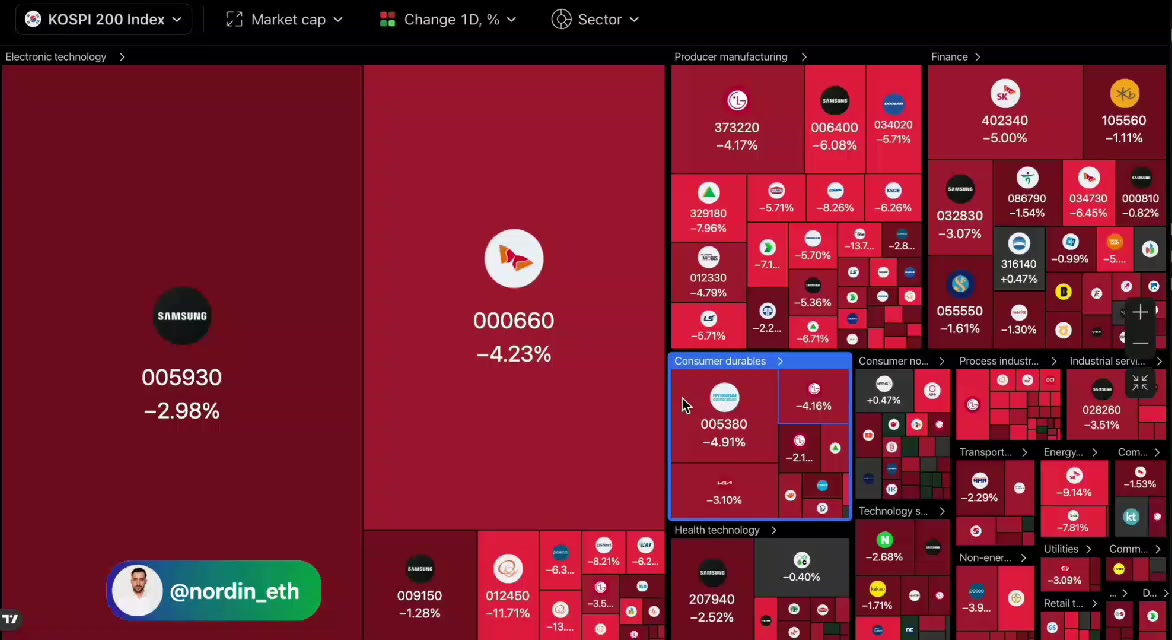
🇰🇷 Korean stocks are getting absolutely cooked today. Samsung down 2.98%, LG Energy Solution down 4.17%, and SK Hynix down 5%. Is this the dip everyone was waiting for, or the trap nobody wants to admit? #MyByXTake #ByXIMPACT #BybitStocks
🚨$SPCX and $NFLX REPORT Q3 TOMORROW!
I'm just checking $SPCXXUSDT and NFLX before tomorrow's earnings, and here's my take on both setups. 📊 $SPCXXUSDT - $148.63 on my chart Price is right now at the $147.11 support level. First resistance is at $151.25, second is at $153.75. Break of the support would be bearish for price heading to $143 area, including possible retest of the $140.50 swing low. In case of $SPCXXUSDT, I'd rather see price break through resistance and wait for confirmation. $NFLX - around $69.85 on the last close Support should be monitored at the $69.17–$68.50 level, resistance is at $70.37-$70.90. Above it is the $71.57 level. In case of breakdown of the support, that would change the whole picture. Both stocks report after the close, and therefore the levels above should be considered as potential, not guarantee. Earnings invalidate a chart fast enough, and capital protection is more important than predicting a candle. But one thing that I've experienced as a trader your choice of a platform can be very limiting in some cases. Let's say you hold NFLX for a long term, but suddenly $BTCUSDT drops 10%. You see an opportunity but can't trade it due to capital being invested. The process of selling, getting settled, and transferring can take some time. When the money is transferred to your exchange, the moment might be missed already. And that's where I got interested in the concept of rToken. The ability to transfer eligible stock assets without having to sell them first allows you to combine your stocks and crypto assets under one trading umbrella. You shouldn't have to choose between long-term conviction and short-term opportunities just because your assets are kept at two different exchanges. Would like to know what stock holders do in such situations. Is everything kept separately or you'd rather manage your stocks, ETFs, and crypto from one account? #ByXIMPACT #BybitStocks


📈 WOULD $TSLA TURN BULLISH?
$TSLAXUSDT After opening Friday near $369 on excitement surrounding the highly anticipated Roadster unveiling, $TSLAXUSDT reversed sharply alongside the broader market selloff, closing at $354.72, dangerously close to a critical technical level. The big question now: can $TSLAXUSDT defend $347.90, or is another major leg lower about to begin? $TSLAXUSDT triggered a long-term sell signal approximately three months ago after breaking below its nearly two-year rising channel, whose lower boundary now stands at $401.45. Despite subsequent rallies and several weeks of sideways consolidation, the bearish structure remains unchanged. The $396–$401 region continues to represent major overhead resistance and a potential selling opportunity on upward retracements. Unless $TSLAXUSDT closes above $401.45, the longer-term downside targets remain $273.64 and potentially $229.80 over the coming months, with those support formations converging around February 2027. Friday's sharp reversal brought $TSLAXUSDT dangerously close to $347.90, the most important immediate support level. As long as $347.90 holds, a short-term rebound remains possible. The first key resistance is $368.53, a channel boundary that Tesla briefly reclaimed Friday before collapsing back below it. A daily close above $368.53 would generate a short-term bullish signal, potentially establishing a weekly low and opening the door to a recovery toward the upper $380s and lower $390s within one to two weeks. $370.57 represents an additional aggressive upside pivot, although a close above $368.53 would already be sufficient. But even a rally toward $390 would remain a countertrend move within the larger bearish structure. A daily close below $347.90 would trigger a fresh downside SELL SIGNAL and significantly reduce the likelihood of revisiting the $390s anytime soon. The downside roadmap: – $347.90 — critical support and bearish trigger – $332.21 — initial downside target, based on a 5/8 Fibonacci retracement, potentially as soon as the following session – $306.22 — next major downside objective within two to three weeks – $273.64 — longer-term target over the next two to three months – $229.80 — deeper structural support target into early 2027 What would turn $TSLAXUSDT bullish? Only a confirmed close above $401.45 would reverse the long-term bearish signal. That could open the door to a substantial advance toward $554.20, the upper boundary of Tesla's six-year channel, potentially by the end of Q1 2027. So, Tesla's Roadster-driven rally has failed, and the stock remains technically vulnerable. Above $347.90, a rebound toward $368.53 and potentially $390 remains possible. Below $347.90, the next major sell signal activates, putting $332 and $306 in focus. The long-term trend remains bearish until $401.45 is reclaimed. Watch $347.90 today. The next decisive move could set the tone for Tesla over the coming weeks. #TSLATookOffLiterally #TSLAtooktothemoon #ByXIMPACT

🚨 EVERYTHING THAT COULD GO WRONG IS HAPPENING IN FRANCE RIGHT NOW. France is facing violent nationwide unrest, a growing debt crisis, rising inflation, and government borrowing costs approaching their highest levels in 24 years. The situation has become so serious that President Macron has held emergency crisis meetings, while Prime Minister Sébastien Lecornu has warned that a state of emergency could be declared if necessary. At least 2,400 people have been arrested following violent riots across Paris, Marseille, Lyon and other cities. Thousands of businesses have been damaged, shops have been looted, public buildings have been set on fire, and nearly 1,000 security officers have reportedly been injured. Macron condemned the violence, promised tougher action against rioters, and warned that authorities could ban certain gatherings. The government is now introducing localized curfews, while opposition politicians are demanding a nationwide state of emergency. The unrest started amid growing anger over living costs, education and deteriorating public services. And the economic situation explains why public anger has become so serious. France's annual inflation jumped from 2.4% in August to 3.1% in September, while energy inflation reached 21.3%. The economy contracted 0.2% in Q1, recorded zero growth in Q2, and is estimated to have grown just 0.1% in Q3. Unemployment has reached 8.3%, household purchasing power is falling, and more than 70,000 businesses have failed over the past 12 months. Meanwhile, the government is dealing with a much bigger financial problem. France's public debt has reached nearly €3.6 TRILLION, equivalent to 119% of GDP. Debt increased by more than €135 billion in just the first six months of 2026. Government spending already accounts for 57.2% of GDP, while the public deficit stood at 5.1% in 2025. France needs to reduce spending and bring its deficit under control, but those measures are becoming much harder to implement. People are already protesting over living costs and public services, while the government needs to make difficult budget decisions to stop its debt from growing even faster. The unrest is also creating fresh uncertainty just as the government needs parliamentary support for its next budget. And investors are responding to France's financial problems. The country's 10-year government bond yield climbed to 4.9% today, approaching levels last seen in 2002. The spread over German bonds has widened to around 145 basis points, reflecting the higher borrowing costs investors are demanding from France. Higher yields mean the government will have to pay more when issuing new debt and refinancing existing obligations. France's state debt service costs are projected to jump from €62.6 billion in 2026 to €72.9 billion in 2027. That's an additional €10.3 billion in just one year, at a time when the government is already struggling to control its deficit. And the pressure could increase further. Moody's currently has a negative outlook on France, with another credit-rating review scheduled for October 23. If investors lose more confidence in France's ability to control its finances, borrowing costs could rise further, putting additional pressure on banks, businesses, households and government spending. France now needs to restore public order, respond to demands for better living conditions, reduce its deficit and convince bond investors that its debt is manageable. But the measures needed to fix its finances could also increase public anger and make the political situation even harder to control. $BTCUSDT $ETHUSDT #ByXIMPACT
A POSSIBLE REJECTION NEAR RESISTANCE 📉.
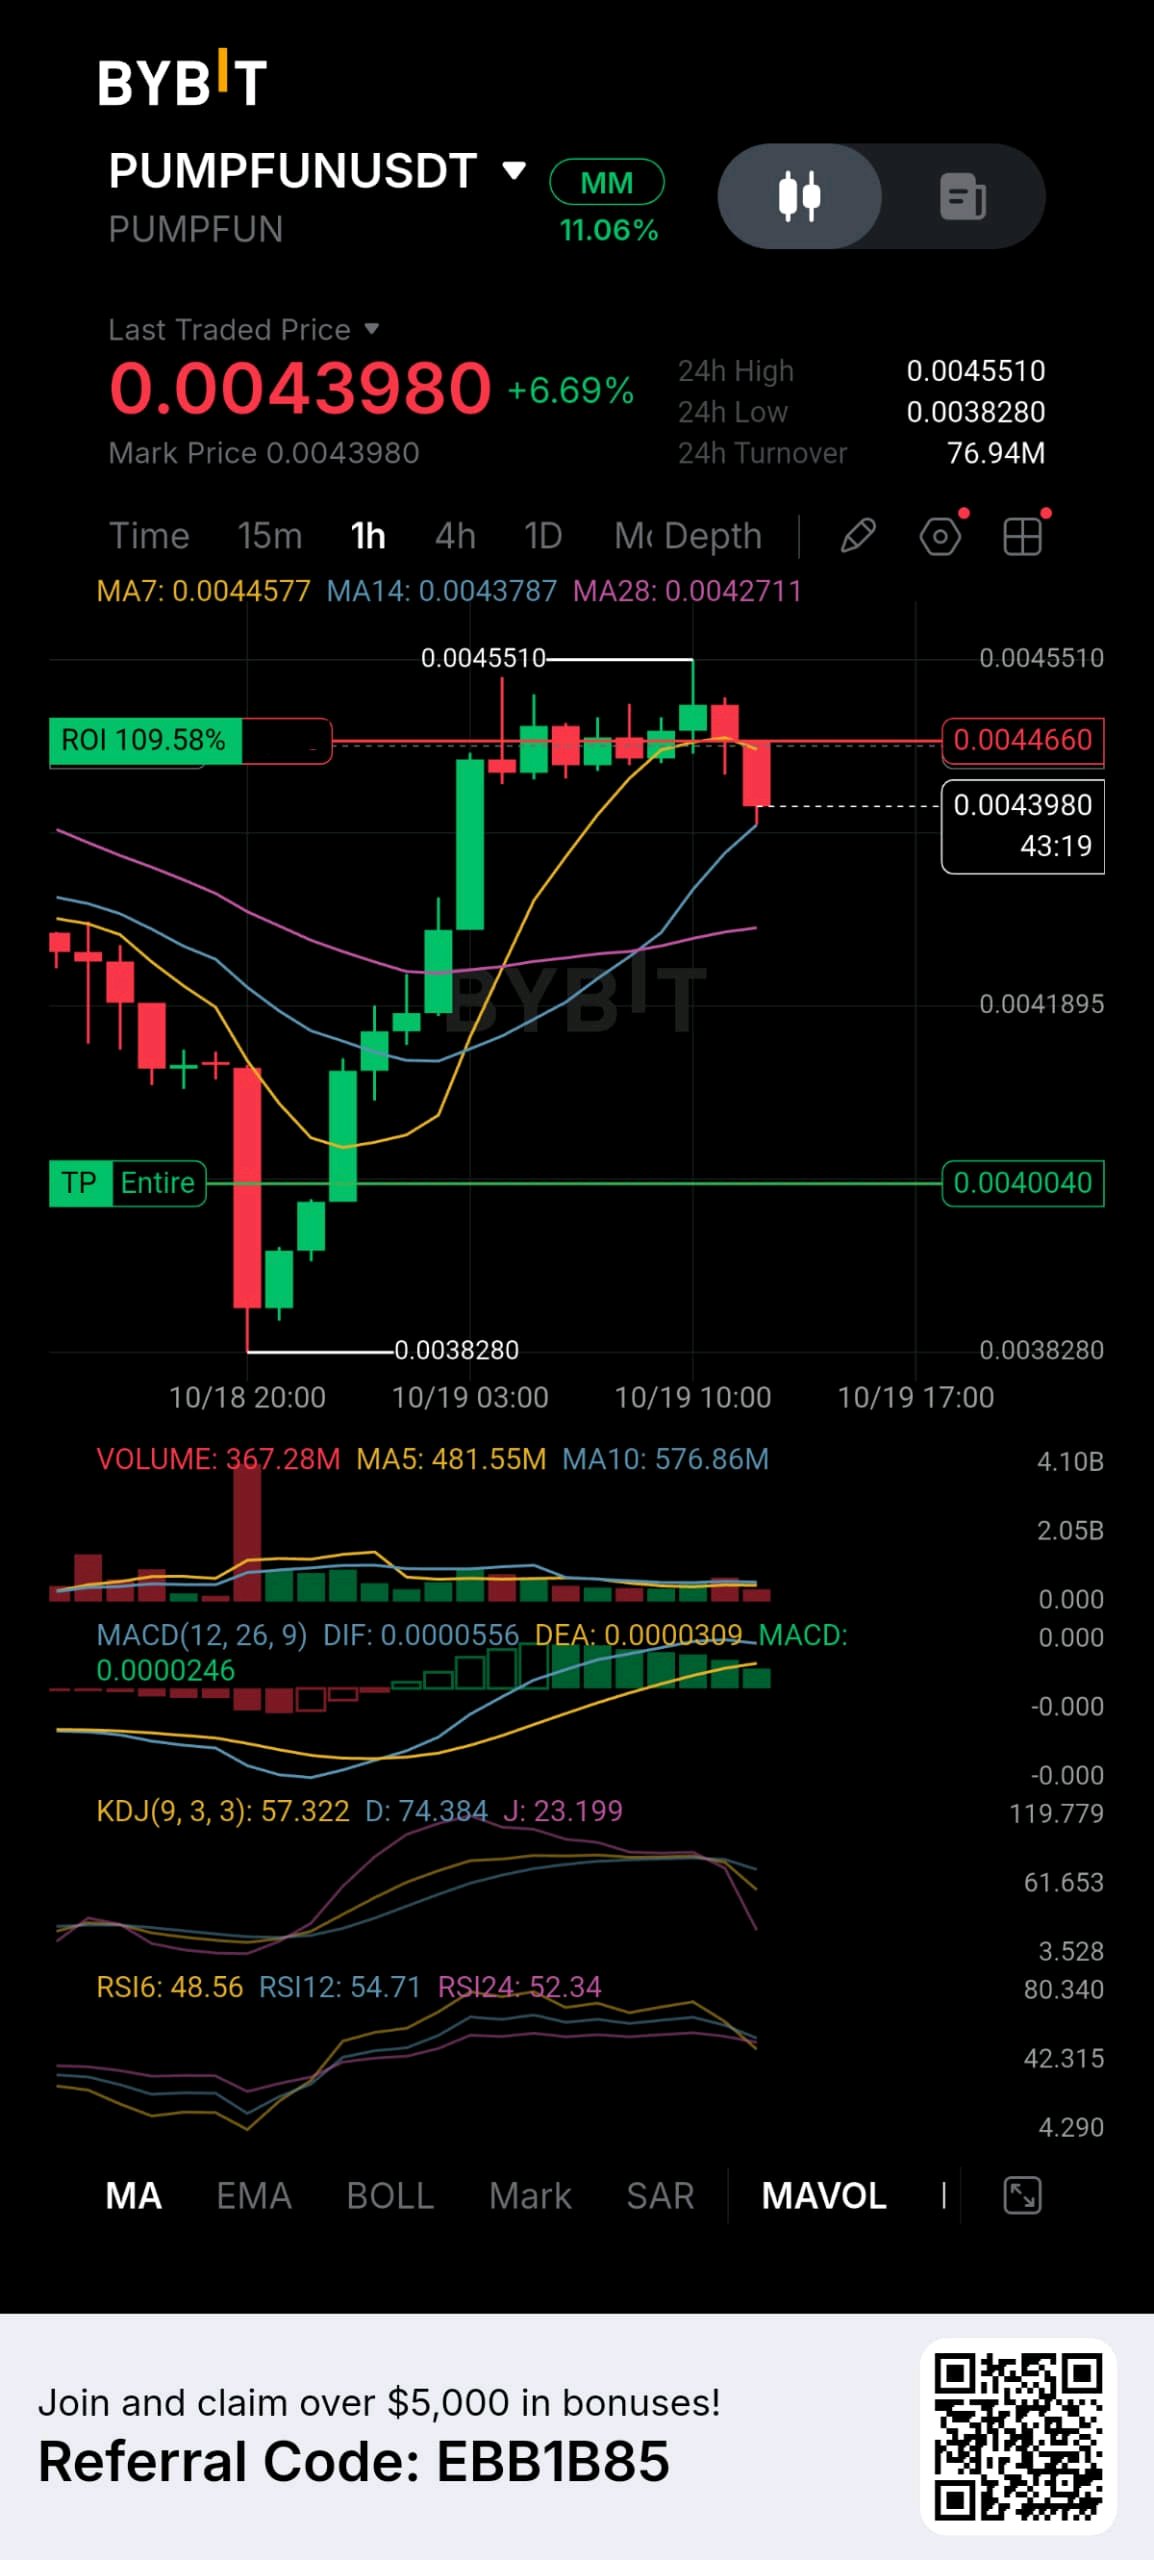
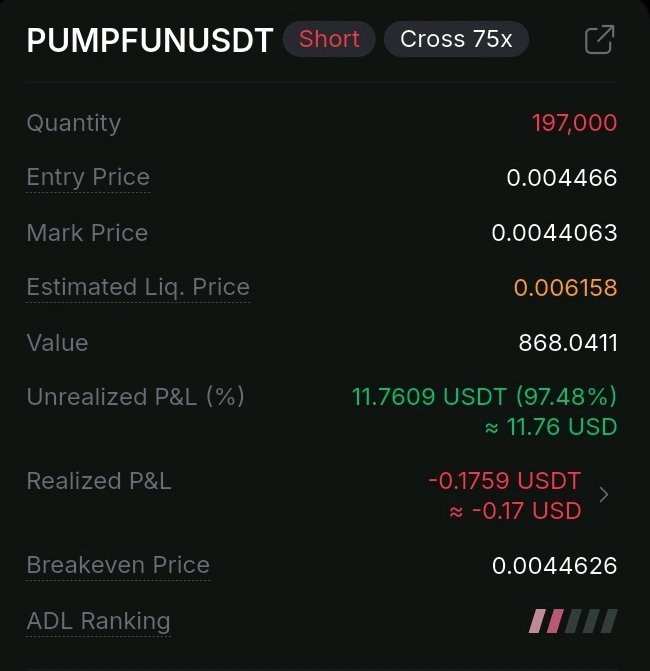
A strong rebound can create opportunity, but it can also trap traders who mistake a temporary pullback for a confirmed reversal. My $PUMPUSDT (PUMPFUNUSDT) short is built around one key question: can price sustain its recovery, or will resistance trigger another move lower? 📊 THE TECHNICAL CASE On the 1H chart, PUMP rebounded sharply from 0.003828 and reached a high of 0.004551 before momentum began to cool near the 0.0044–0.0045 region. My entry was 0.004466, close to that resistance area. Here’s what I’m monitoring: 🔹 MA7: 0.0044577 — price slipped below this short-term average. 🔹 MA14: 0.0043787 — nearby support that needs to be watched. 🔹 MA28: 0.0042711 — a deeper support reference if bearish momentum develops. 🔹 MACD: still positive, so the rebound has not been fully invalidated. 🔹 RSI: around the neutral zone, suggesting neither side has decisive momentum from these readings alone. 🎯 MY TRADE PLAN AND INVALIDATION A sustained break below 0.004379, followed by a failed attempt to reclaim it, would strengthen the bearish case. My chart marks 0.004004 as the take-profit level. However, a sustained move above 0.004551 would challenge the immediate rejection thesis. I need to reassess the setup if the evidence changes rather than defend my bias. 📉 THE RISK LESSON At 75× cross leverage, even a relatively small price move against the position can have a significant impact. Risk management must come before excitement about ROI. For me, the real value of this trade is not simply whether the price falls. It is whether my reasoning holds up, whether I respect invalidation, and whether I learn from the outcome. 🤝 LET’S DISCUSS: Would you wait for a confirmed break below 0.004379 before considering the bearish setup stronger, or do you think the rejection near 0.004466–0.004551 already provides meaningful evidence? $PUMPUSDT #ByXIMPACT
🐦 WEEKLY MACRO & CRYPTO DIGEST: OCTOBER 19–25
Greetings, traders! China GDP kicks off the week, followed by UK CPI, Flash PMIs, and the Plan ₿ Forum in Lugano. Add $100M+ in token unlocks and continued ETF outflows. All times in UTC for our global community. 📅 MONDAY, OCTOBER 19 🇨🇳 02:00 UTC = China GDP (Q3) = Consensus: 4.4% YoY (prior: 4.3%) 🇨🇳 02:00 UTC = China Industrial Production, Retail Sales, Fixed Asset Investment (Sept) 🐋 MARA moved 1,000 $BTCUSDT to and Exchange = analysts flag potential miner selling pressure 📅 TUESDAY, OCTOBER 20 🇨🇳 01:15 UTC - China PBoC Loan Prime Rate. Expected: hold at 3.00% (1Y) and 3.50% (5Y) 🇩🇪 06:00 UTC - Germany PPI (Sept) 🇪🇺 09:05 UTC - Germany ZEW Economic Sentiment (Oct) 🇺🇸 12:30 UTC - US Housing Starts (Sept) 🔓 LayerZero unlock- ~23.28M tokens (~$43.3M), 3.83% of supply, at 03:00 UTC Kaito - ~$5M 📅 WEDNESDAY, OCTOBER 21 🇬🇧 06:00 UTC - UK CPI (Sept) 🇬🇧 15:00 UTC - BoE Governor Bailey speech 🇺🇸 14:30 UTC - US Crude Oil Inventories 🔓 Akedo unlock - ~$63.4M, 9.25% of market cap 📅 THURSDAY, OCTOBER 22 🇺🇸 12:30 UTC - Initial Jobless Claims (Weekly) 🇺🇸 20:30 UTC - Fed Balance Sheet 📅 FRIDAY, OCTOBER 23 🟠 Plan ₿ Forum - Lugano, Switzerland (Oct 23-24) 🇪🇺 08:00 UTC - EU Flash PMIs (Oct Prelim) 🇺🇸 13:45 UTC - US Flash PMIs (Oct Prelim) 🇺🇸 14:00 UTC - Michigan Inflation Expectations (Oct Prelim) 📅 SATURDAY, OCTOBER 25 🔓 Plasma unlock - ~$18M, 12.66% of market cap 📊 $BTCUSDT PRICE OUTLOOK Real money on $BTCUSDT hitting these levels by year-end: 🔹 $85,000 - 80% chance 🔹 $90,000 - 59% chance 🔹 $95,000 - 39% chance 🔹 $100,000 - 25% chance ⚡ What Market Is Watching This Week 1️⃣ China GDP (Mon) - Q3 growth expected at 4.4% YoY. A miss could reignite global growth concerns and pressure risk assets. 2️⃣ UK CPI + Bailey (Wed) - UK inflation data followed by the BoE Governor's speech. Any hawkish signal could ripple across global bond markets. 3️⃣ ETF Outflows Continue - Second straight week of outflows (~$228M for Oct 12–16). Institutional demand remains muted - a key backdrop for price. 4️⃣ MARA's 1,000 $BTCUSDT Move (Mon) - Miner transfers to exchanges are closely watched as potential selling signals. 5️⃣ Token Unlocks - Over $140M this week. AKE (~$63.4M) Wednesday, ZRO (~$43.3M) Tuesday, XPL (~$18M) Saturday. 6️⃣ Plan ₿ Forum (Fri-Sat) - Lugano's Bitcoin conference. Potential announcements and sentiment catalyst. Stay sharp. China GDP and UK CPI set the tone. #ByXIMPACT #BybitStocks #USCPI

🚨 $ZEC UPDATE 👀
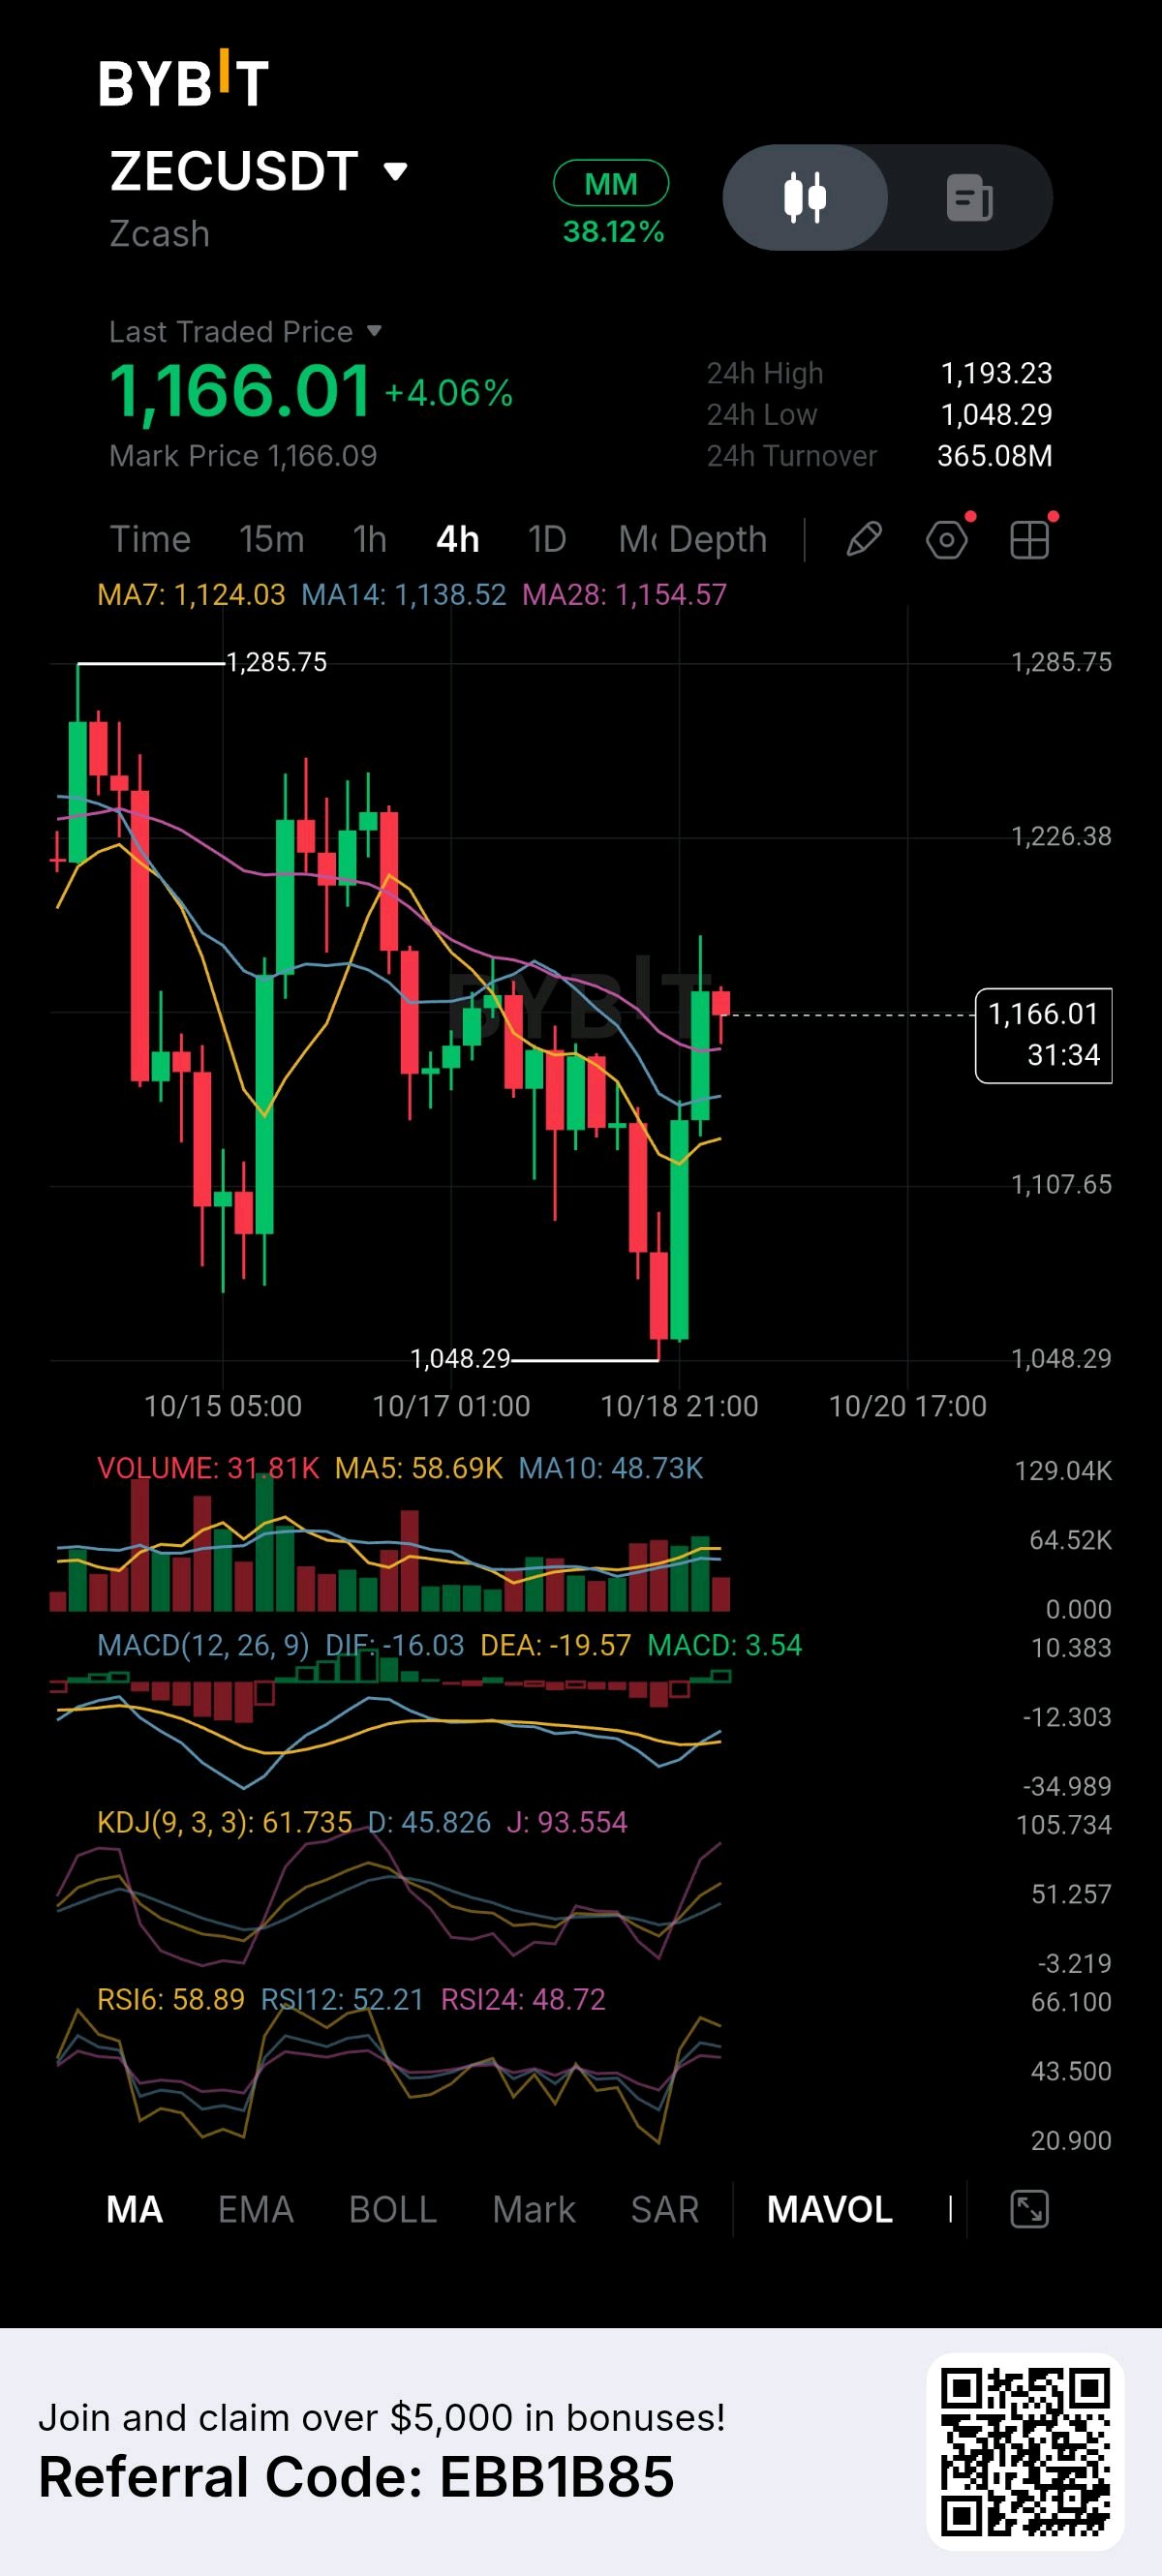
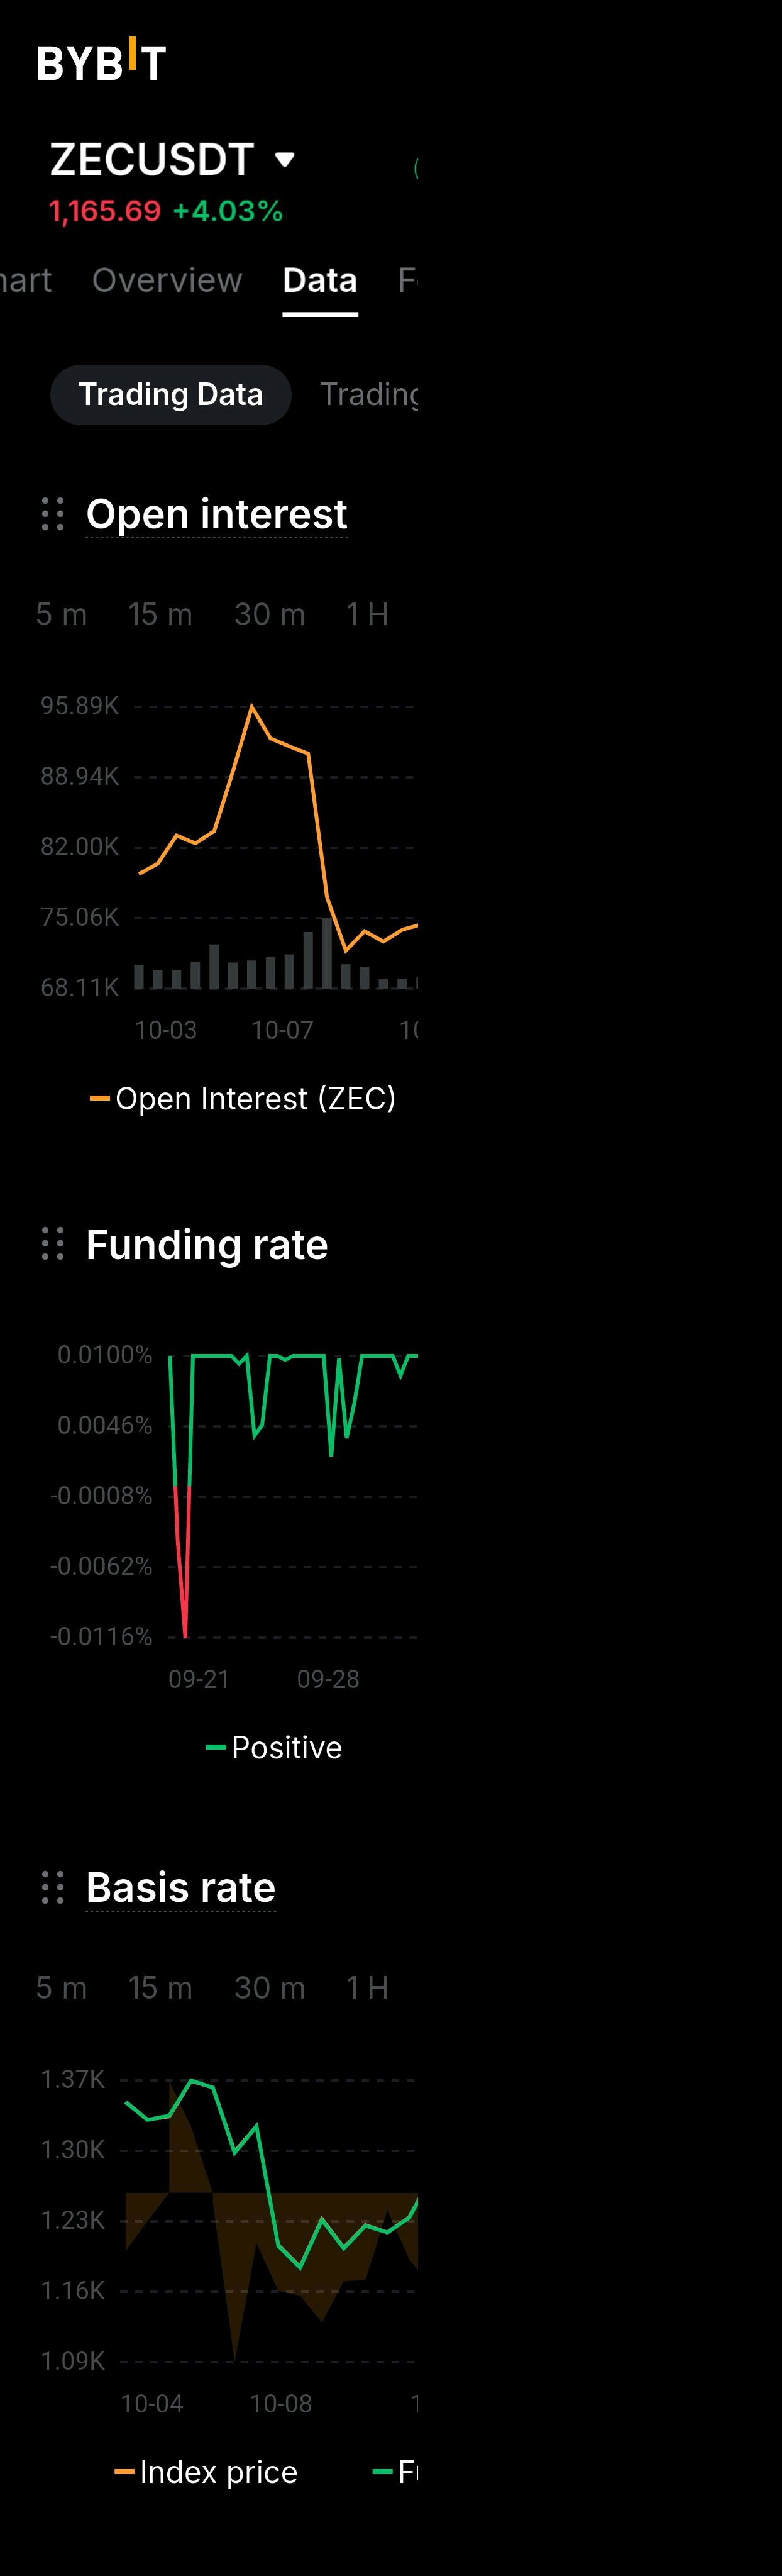
$ZEC a $6.9M sell wall appeared at ~$1,210 in the last few hours, right above the short whales’ average entry of $1,199. Price bounced 10% from ~$1,050 and is now about 4% below it. Positioning now: - Short whales still hold $178.9M, almost unchanged through the bounce - Whales 20% long, crowd 43% - Long whales up from 117 to 155, but their size is only $45.1M The wall and the short entry sit almost on the same level. If the wall gets pulled or absorbed, short whales go into loss and the next liquidation clusters are $11.9M at $1,341-1,358. A rejection there keeps $1,040 in play. $BTCUSDT $HYPEUSDT #ByXIMPACT
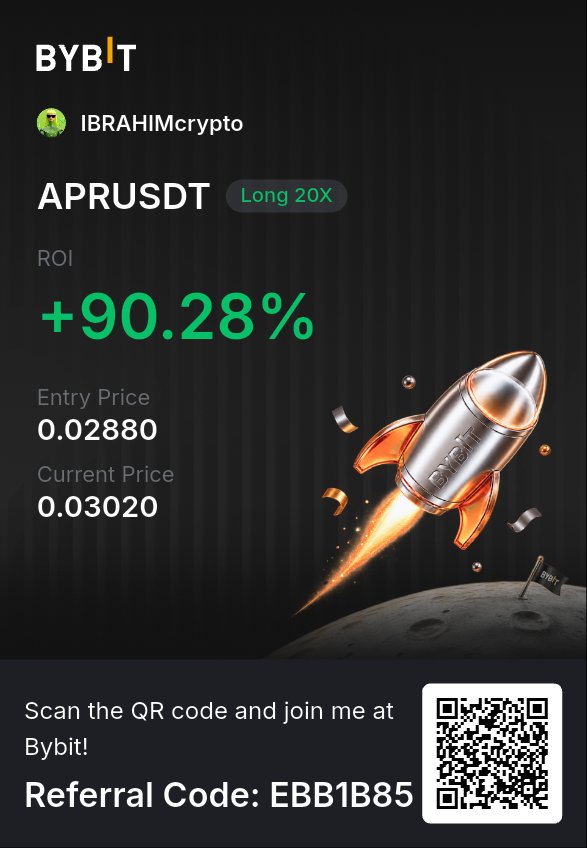
🩸 $APR CRASHES 96% 📉👀
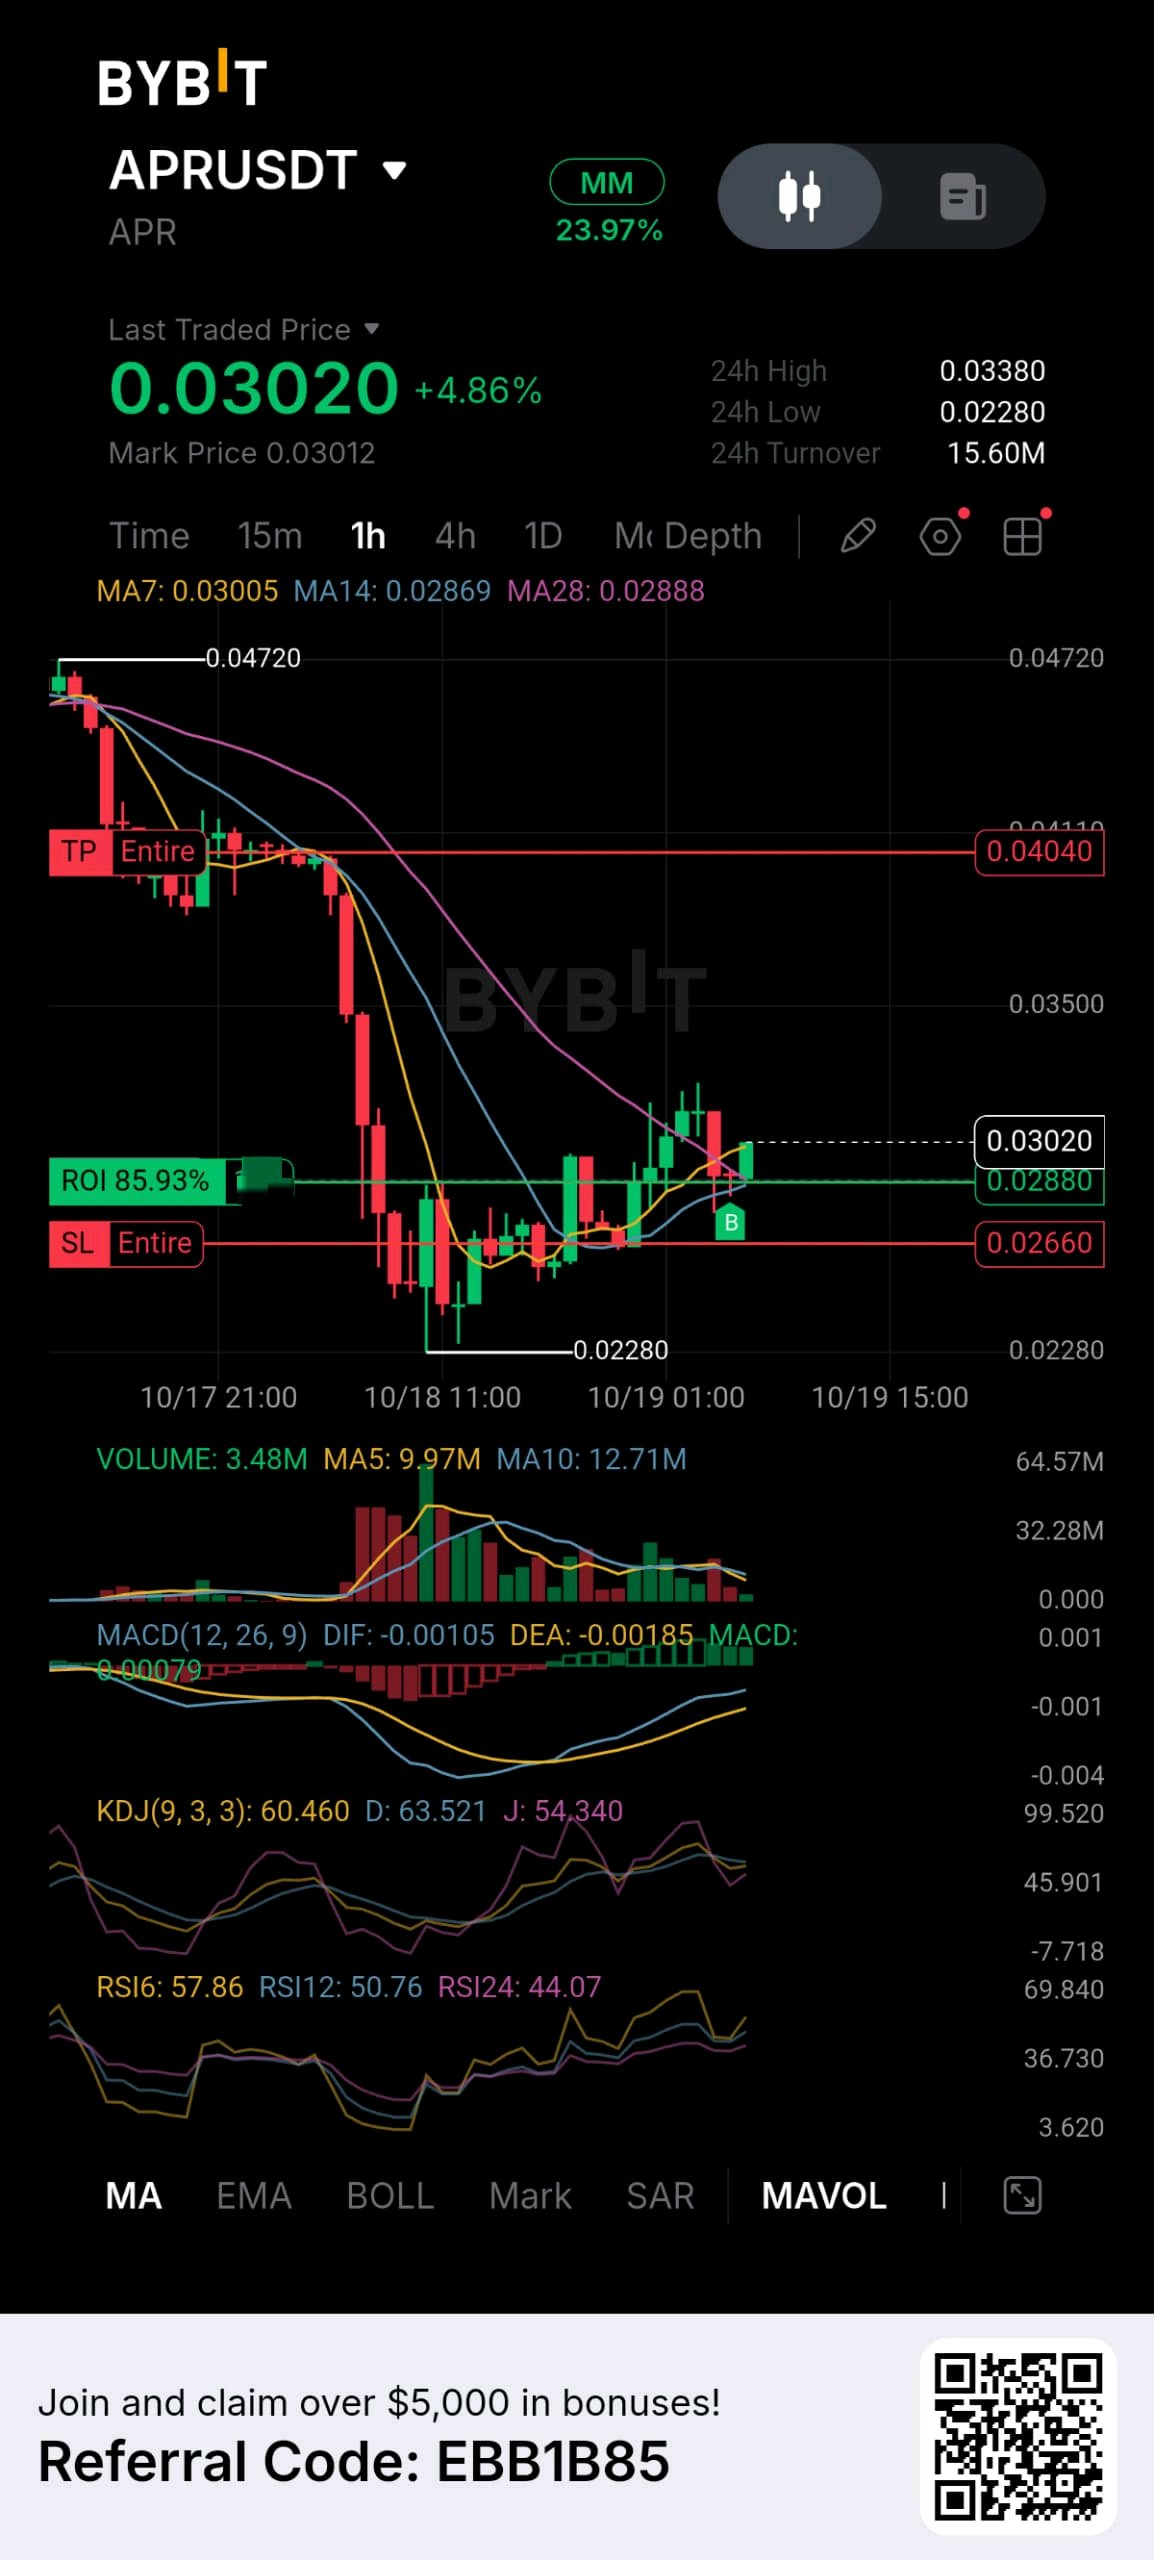
$APR Is Capricorn Crypto Going to ZERO Before the Oct 23 Unlock? Capricorn ($APR) is already down 96%, from $0.6255 to $0.0229. Now the biggest unlock in its history is coming 👇 Oct 23 Token Unlock: → 146.7M APR worth $3.73M → About 53% of circulating supply → Early backers and the team are the largest recipients Supply Shock: Released supply jumps from 314M to 461M APR (31% to 46% of total). Past unlocks were only +10%. This one is +46.67%, the first VC and team cliff. Hidden Risk The August buyback tokens were never burned and can return to market. Thin Liquidity: Order books are only $3K–$25K deep at 2%. Little buying power to absorb the sell pressure. $APR Price Analysis: HTF breakdown below $0.14, new all-time low, HTF bias still bearish. $BTCUSDT $XRPUSDT #ByXIMPACT
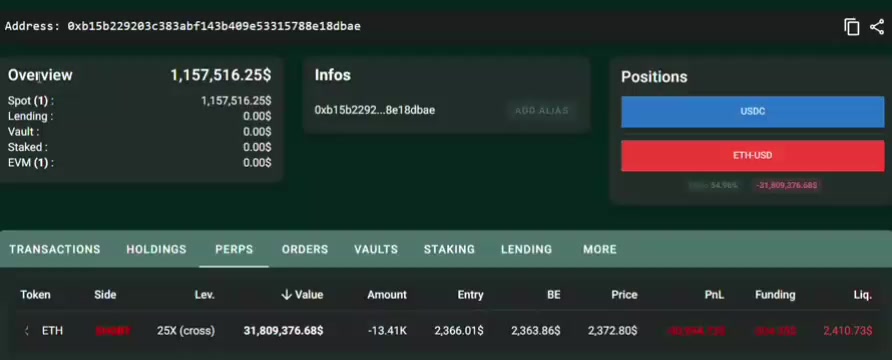
CRAZY GAMBLE:
A whale has just opened a $31.8 million $ETHUSDT short with 25x leverage He is only $37 away from getting fully wiped out. #ByXIMPACT
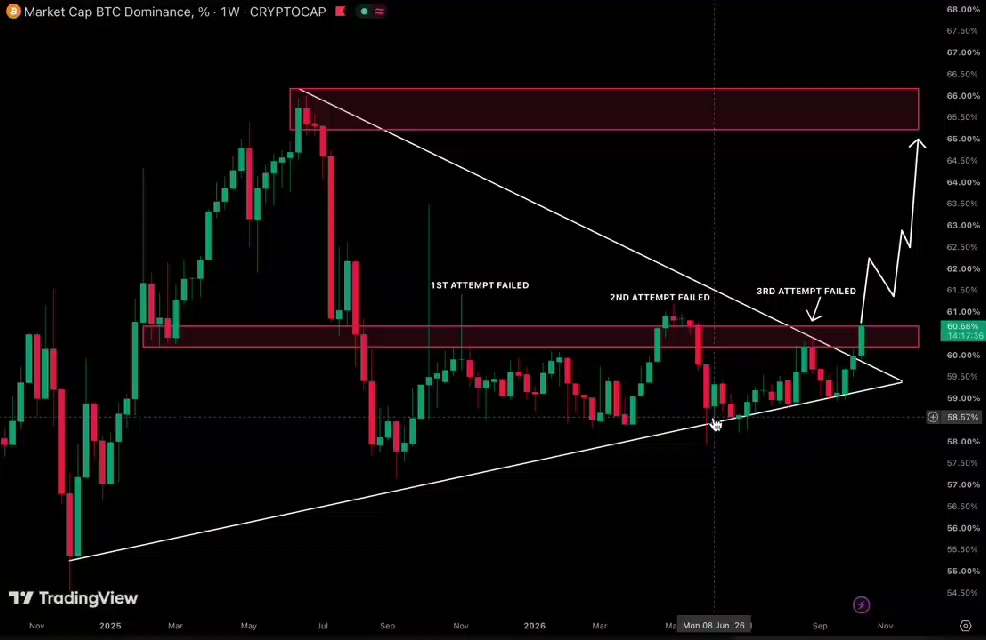
🚨 PAY ATTENTION FELLAS.
$BTCUSDT dominance has tried to break this resistance 3 times and got rejected every single time Meanwhile, the triangle is getting tighter If BTC.D finally breaks out, alts might be in trouble But if it gets rejected AGAIN? We might finally see some money flow back into alts Imagine fading alts right before the rotation starts Watching this one #ByXIMPACT
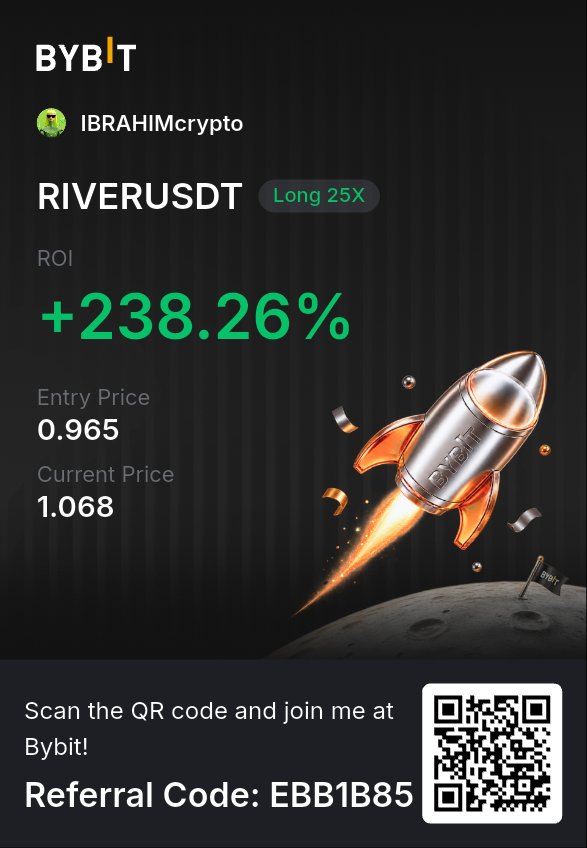
THE WEEK IN TRADES: RESULTS, LESSONS & WHAT'S NEXT
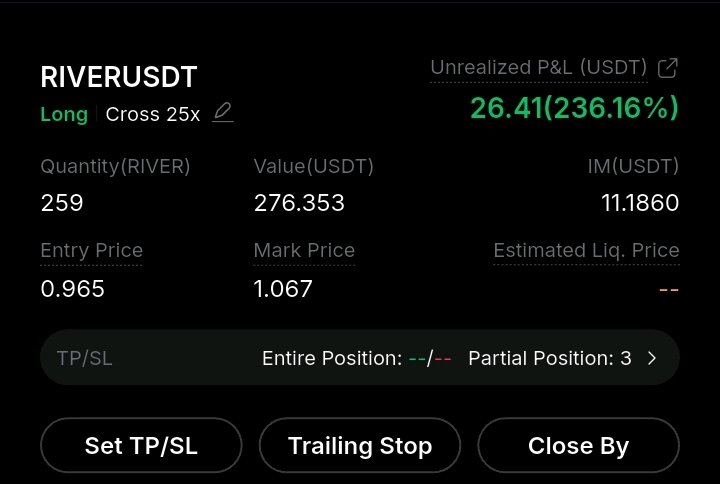
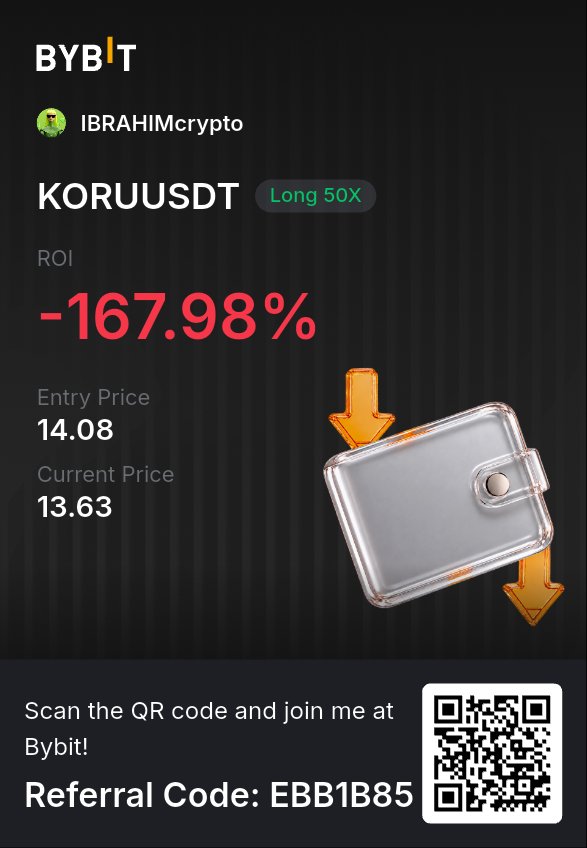
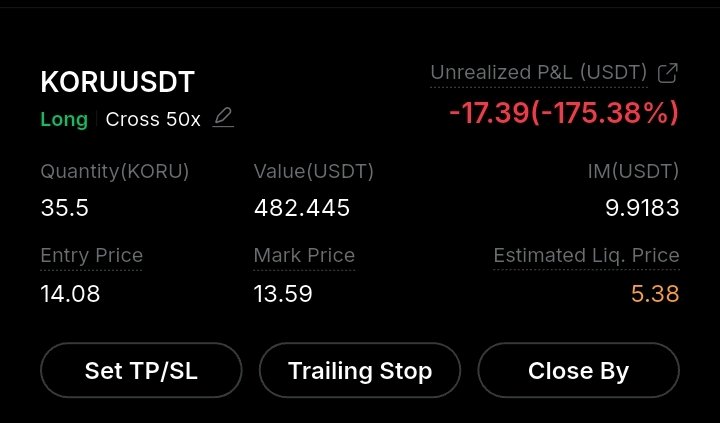
📊 THE WEEK IN TWO TRADES: ONE GREEN, ONE UNDER PRESSURE 💪. Two positions. Two very different experiences. One important reminder: trading is about decisions, not just numbers. 🎯 This week, I'm reviewing two open positions in my trading journal. One is showing a strong unrealized gain, while the other is a reminder that a trade can move against you even when you have a plan. 🟢 TRADE 1: RIVERUSDT — THE REBOUND • Direction: Long • Entry price: 0.965 USDT • Unrealized P&L: +26.41 USDT • ROI: +236.16% • Leverage: 25× Cross RIVER has rebounded from the 0.916 area marked on my chart. The position is in profit, but the real challenge is managing it objectively. A strong rebound doesn't guarantee continued upside, and unrealized profit isn't secured profit. 🔴 TRADE 2: KORUUSDT — THE REALITY CHECK • Direction: Long • Entry price: 14.08 USDT • Unrealized P&L: -17.39 USDT • ROI: -175.38% • Leverage: 50× Cross KORU is moving against the entry, and this position highlights why risk management matters just as much as finding opportunities. The lesson isn't to panic or blindly wait for a recovery. It's to reassess the original thesis, understand the exposure, and make decisions based on evidence rather than emotion. WHAT THESE TWO TRADES ARE TEACHING ME ✅ A profitable position still needs active risk assessment. ✅ A losing position deserves an honest review not wishful thinking. ✅ Leverage can magnify returns on margin, but it also magnifies risk. ✅ Every trade needs a clear plan for what would change the original decision. Neither position was closed in the screenshots, so these are unrealized results not final wins or losses. Both can change as the market moves. 💬 LET'S TALK TRADING, NOT JUST P&L. When one position is in profit and another is under pressure, what do you prioritize first? A) Protecting gains on the winning trade B) Reassessing the trade moving against you C) Reviewing the risk of both positions together Tell me your reasoning. Let's learn from the decisions behind the numbers. 🤝📈 $BTCUSDT $ETHUSDT #ByXIMPACT
$BTCUSDT In my view the market wants to go lower first and collect liquidity in the $70-75K zone There’s a big cluster of stops and liquidations sitting there Price loves to go and take that kind of liquidity before any real move Rate hike expectations add fuel to the downside Markets are already positioning for it, so I expect a dip into that zone on the news Once the liquidity is taken and the expectations are priced in, the picture changes That’s where I’m looking for a reversal and a bounce from the lows From there, the path back up toward the supply zone opens Weak hands get flushed, late longs get trapped, and only then the real move starts #ByXIMPACT
🚨 BTC STRUCTURE IS STILL BEARISH 🚨
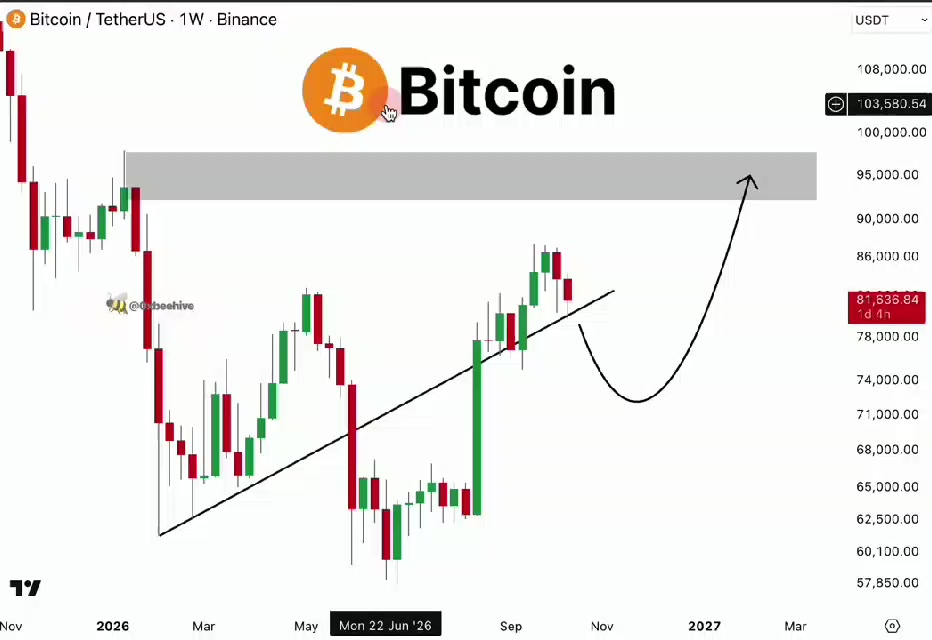
Everything is not going the way you think it is Everyone wants to believe the next leg up is just around the corner But look at the bigger picture We had accumulation, a strong markup, and then distribution near the cycle highs That's nice But since then, $BTCUSDT has broken lower, bounced back, and is now struggling to reclaim the levels it lost That’s why I’m watching for re-distribution rather than a fresh bullish continuation And the macro backdrop isn’t exactly helping the bulls Inflation came in hotter than expected, bringing renewed concerns about higher interest rates Treasury yields remain elevated, while weakness in AI-related stocks is raising broader questions about risk appetite Geopolitical tensions and energy-price shocks add another layer of uncertainty None of this guarantees a crash But it creates an environment where rallies can struggle to sustain themselves This might be usual re-distribution, with the markdown next That’s one og scenarios And I wouldn’t ignore it just because the market wants to stay bullish FOLLOW + NOTIFS ON! #ByXIMPACT
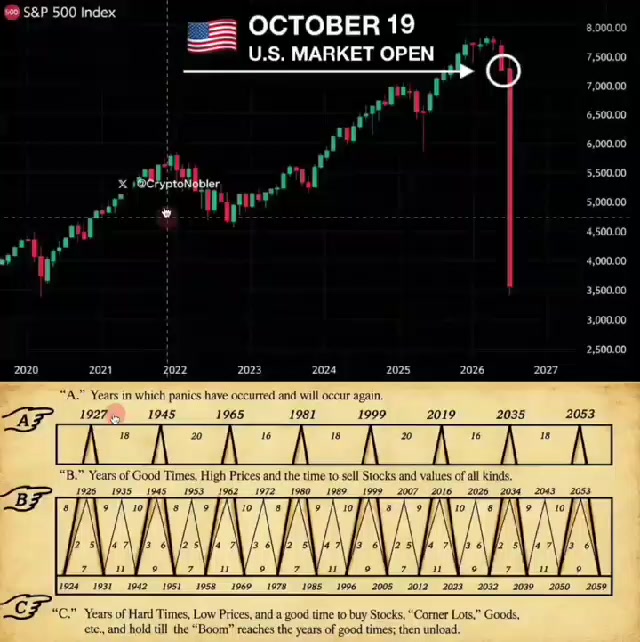
🚨 WARNING: MONDAY WILL BE THE WORST DAY OF 2026!!🩸
98% of people will lose everything. Something terrible just happened behind the scenes. And you MUST know about it before October 19. When markets open next week, this won't be just a normal correction. Stocks will dump. Metals will dump. Bitcoin and crypto will dump even harder. The warning signs are impossible to ignore. → Japan is dumping $5.2 TRILLION in U.S. Treasuries → China is dumping $550 BILLION in U.S. Treasuries → The Strait of Hormuz is still CLOSED → U.S. Treasury yields are SURGING → Inflation is OUT OF CONTROL → The Fed is injecting BILLIONS of cash into economy These are NOT isolated issues. They are interconnected forces driving pressure through the entire financial system. Japan is selling. China is selling. And the debt they unload must find new buyers. To attract those buyers, the market must offer higher yields. That is why Treasury yields are climbing. Investors are demanding greater compensation for the risks of holding long-term U.S. government debt. And this is where the dangerous cycle begins: → Foreign demand for U.S. Treasuries weakens → The market struggles to absorb the growing supply of government debt → Treasury yields rise to attract new buyers → Higher yields increase U.S. government borrowing costs → Rising borrowing costs put pressure on stocks, real estate, crypto, and virtually every other asset → Energy disruptions push oil prices higher and accelerate inflation → Persistent inflation keeps pressure on Treasury yields But there is another factor that makes this situation even more complicated. Fed liquidity injections. Liquidity injections support financial markets by easing funding pressures. But they do NOT eliminate inflation. When additional liquidity enters the system while prices continue rising, the conflict between inflation control and financial stability intensifies. More liquidity can support asset prices. Rising inflation puts pressure on interest rates. Higher yields undermine bonds, stocks, real estate, and other sensitive assets. This is the contradiction people can't afford to ignore. The Fed is trying to maintain financial stability while inflation continues to threaten purchasing power. And the consequences extend far beyond Wall Street. Persistent inflation complicates monetary policy. And when the Treasury market comes under pressure, the shock spreads across EVERY major asset class. Oil, bonds, stocks, crypto, inflation, and central-bank liquidity are all connected. They are moving parts of the same financial system. Most people will focus on the stock market and wait for the crash to begin. But the bond market, inflation data, and liquidity conditions are already flashing warning signs. You must pay attention NOW. I've spent more than 12 years studying financial markets and calling market tops and bottoms. If you want to survive the 2026-2027 cycle, follow me now and turn on notifications. You'll want to know what's happening BEFORE the rest of the market reacts. $BTCUSDT $ETHUSDT #ByXIMPACT
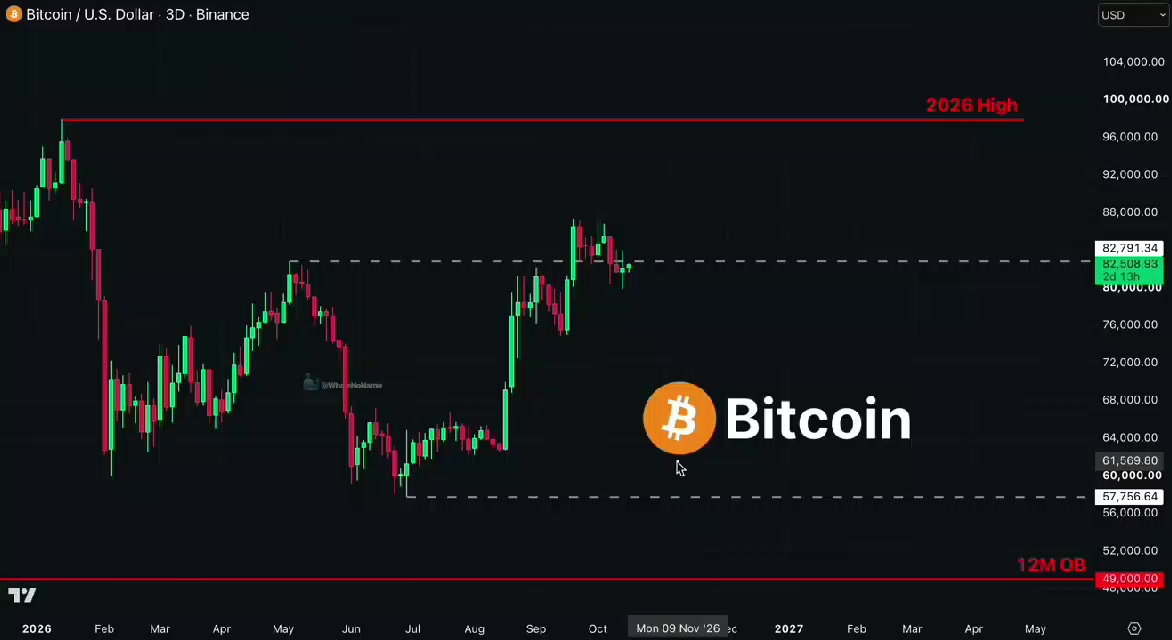
🚨 FINAL $BTC TRAP WILL BE BRUTAL 🩸
The $BTCUSDT relief rally is finally over - the downside phase has just begun I already called a pump above $83k earlier Today I can say just one thing: "A mass $BTCUSDT dump below $75k is inevitable" Based on that, my market plan looks like this: $82K → $75K → $70K → 2-3W accumulation → $105K by Q2-Q3 2027 Save my chart and come back in a few months Most traders see my market calls way too late Turn notifications on so you don't miss the next key market call... #ByXIMPACT