MOON RR
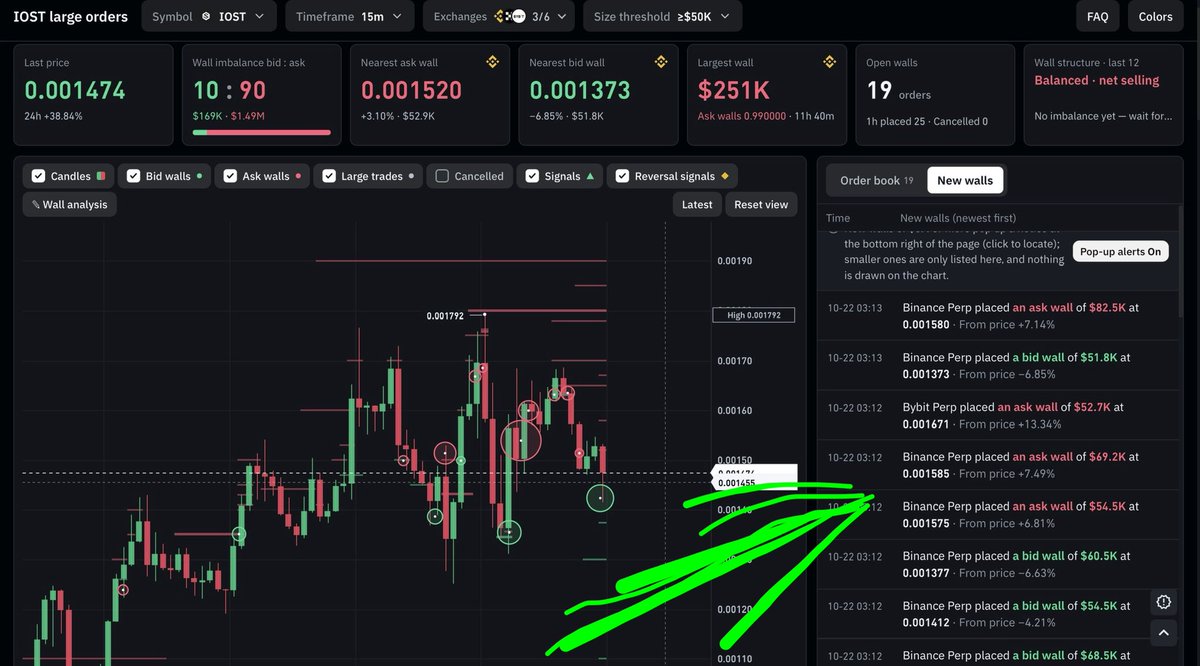
👀 One of the most interesting things I found on $IOST is the strong sell pressure above the current price. $IOST is trading around $0.001474, with major resistance at $0.00158–$0.00167. If buyers break this zone, the next target could be $0.00179. On the downside, $0.00145 is the first support to watch, followed by $0.00137, where a large bid wall is sitting. If buyers defend support, a bounce could follow. But if $0.00137 breaks, further downside is possible. Will buyers absorb the sell pressure, or will sellers push $IOST lower? 👀 NFA. DYOR
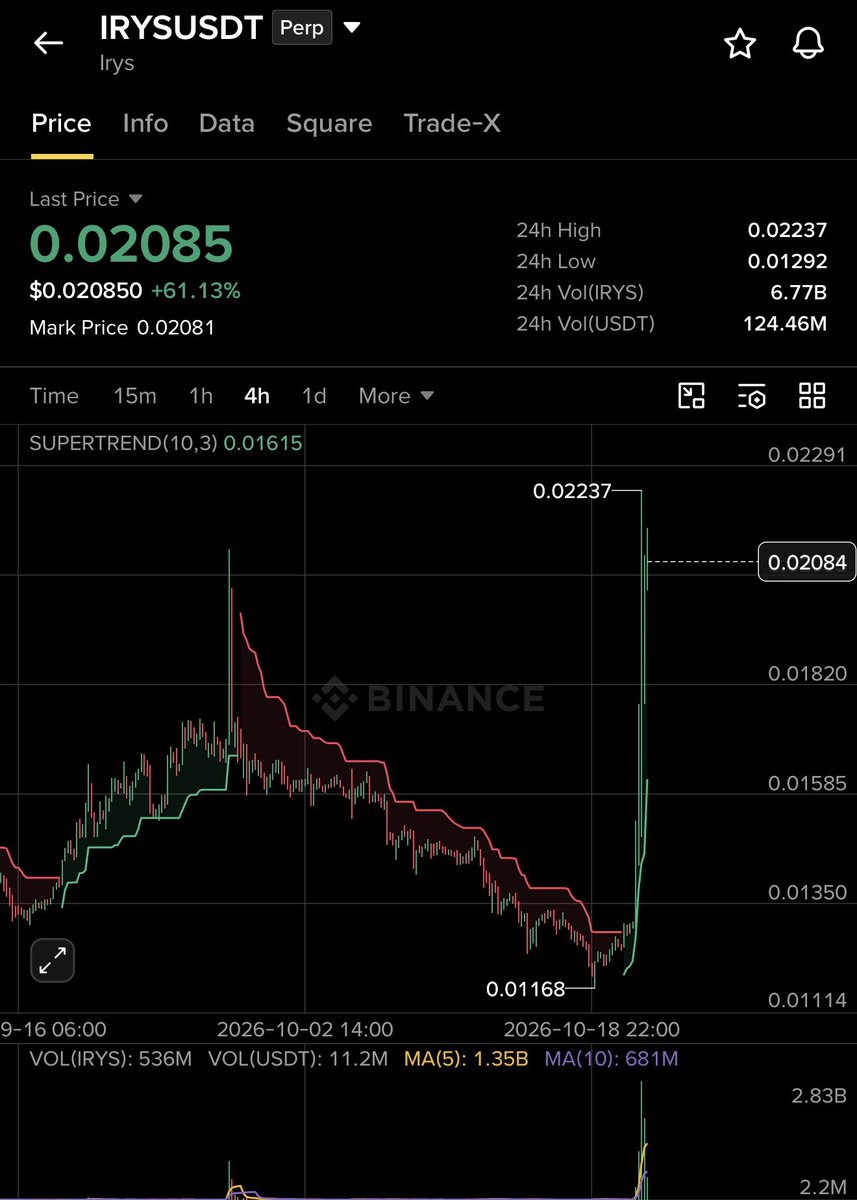
$IRYS pump like a rocket 🚀
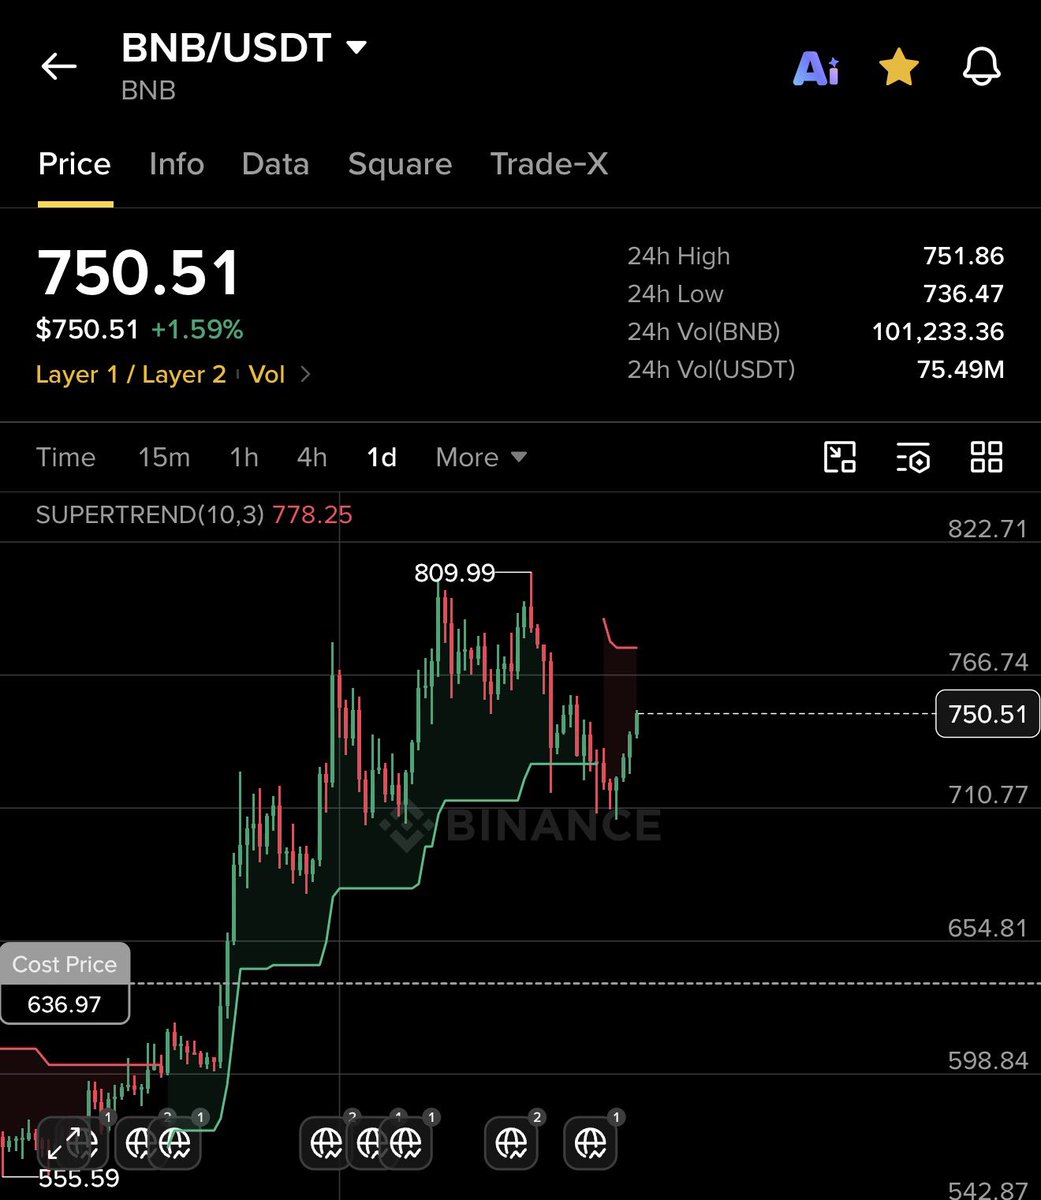
What do you think $BNB cross this high attached? NFA
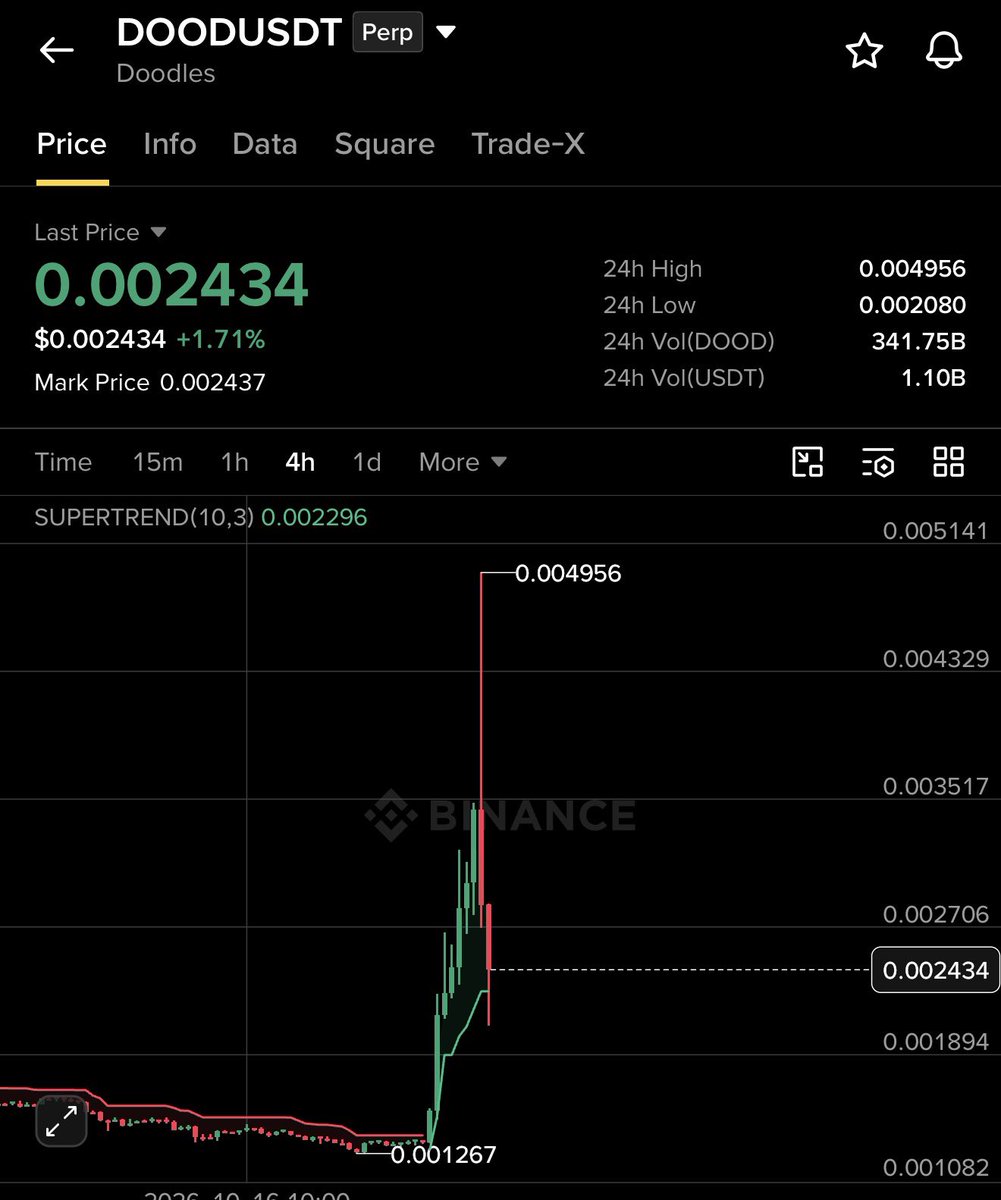
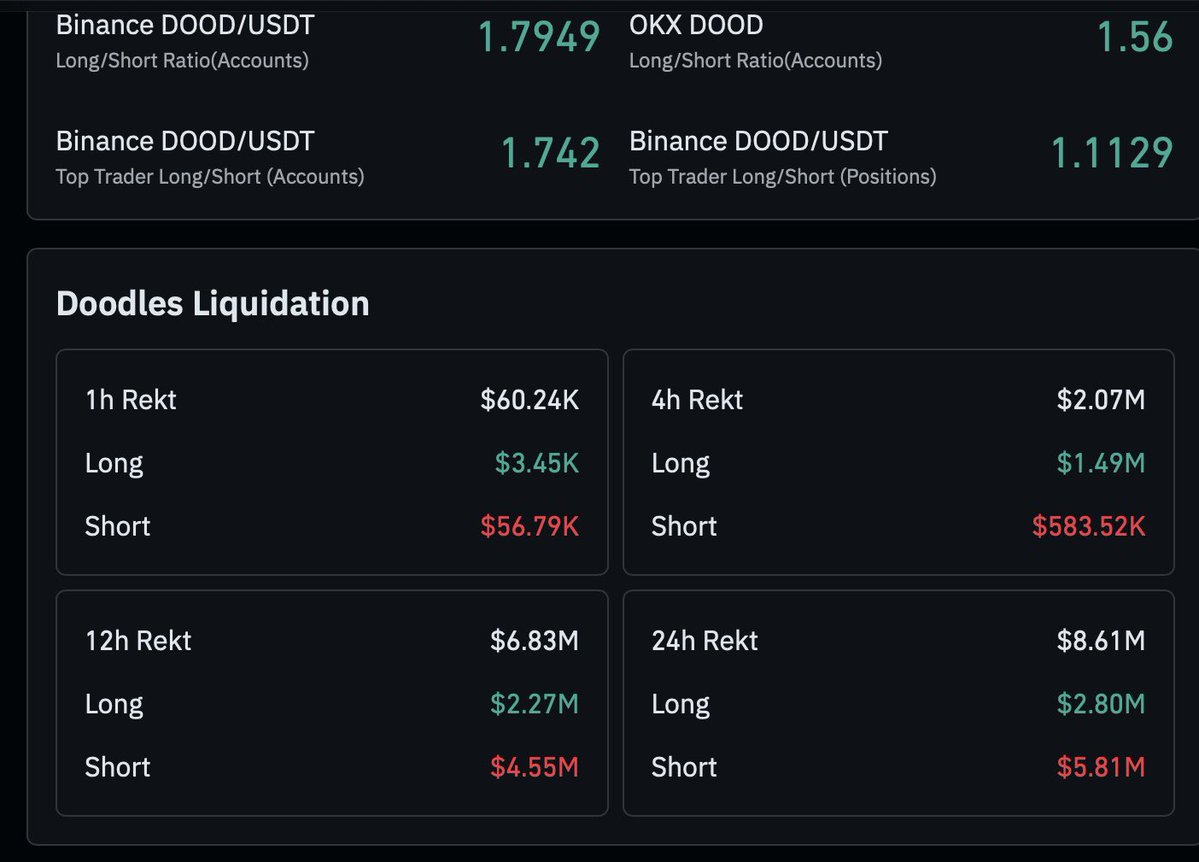
$DOOD Just Wiped Out Millions 💥 After a massive pump to $0.004956, $DOOD dropped sharply to $0.002434. Over $8.61M in liquidations hit the market in 24 hours, with short liquidations leading at $5.81M. Long/short ratios are still favoring longs, so another squeeze is possible. But if $0.00230 support breaks, further downside could follow. Will $DOOD recover or dump further from here? 👀 NFA. DYOR
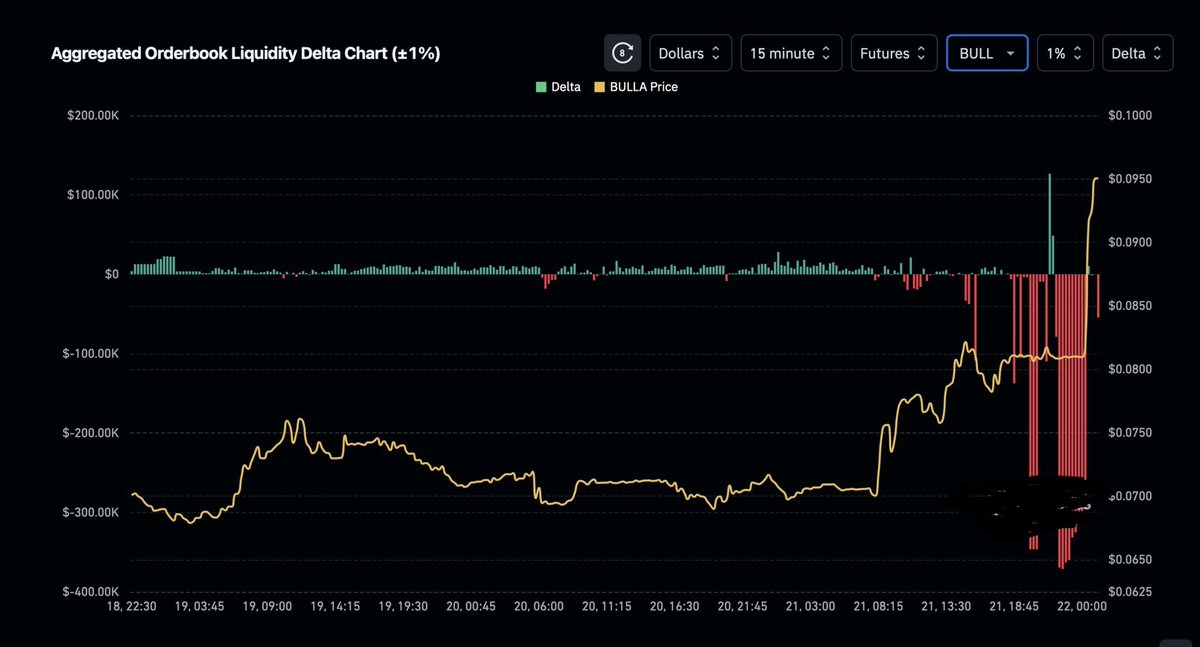
Selling pressure is building up 👀 The $BULLA orderbook shows a sharp increase in negative liquidity delta, with several large sell-side spikes near the $0.065–$0.072 zone. Price recently pushed toward $0.095, but heavy selling pressure could trigger a pullback. If buyers absorb this liquidity, another bounce is possible. Watch how price reacts around these levels. Is this profit-taking or the start of a deeper correction? NFA. DYOR
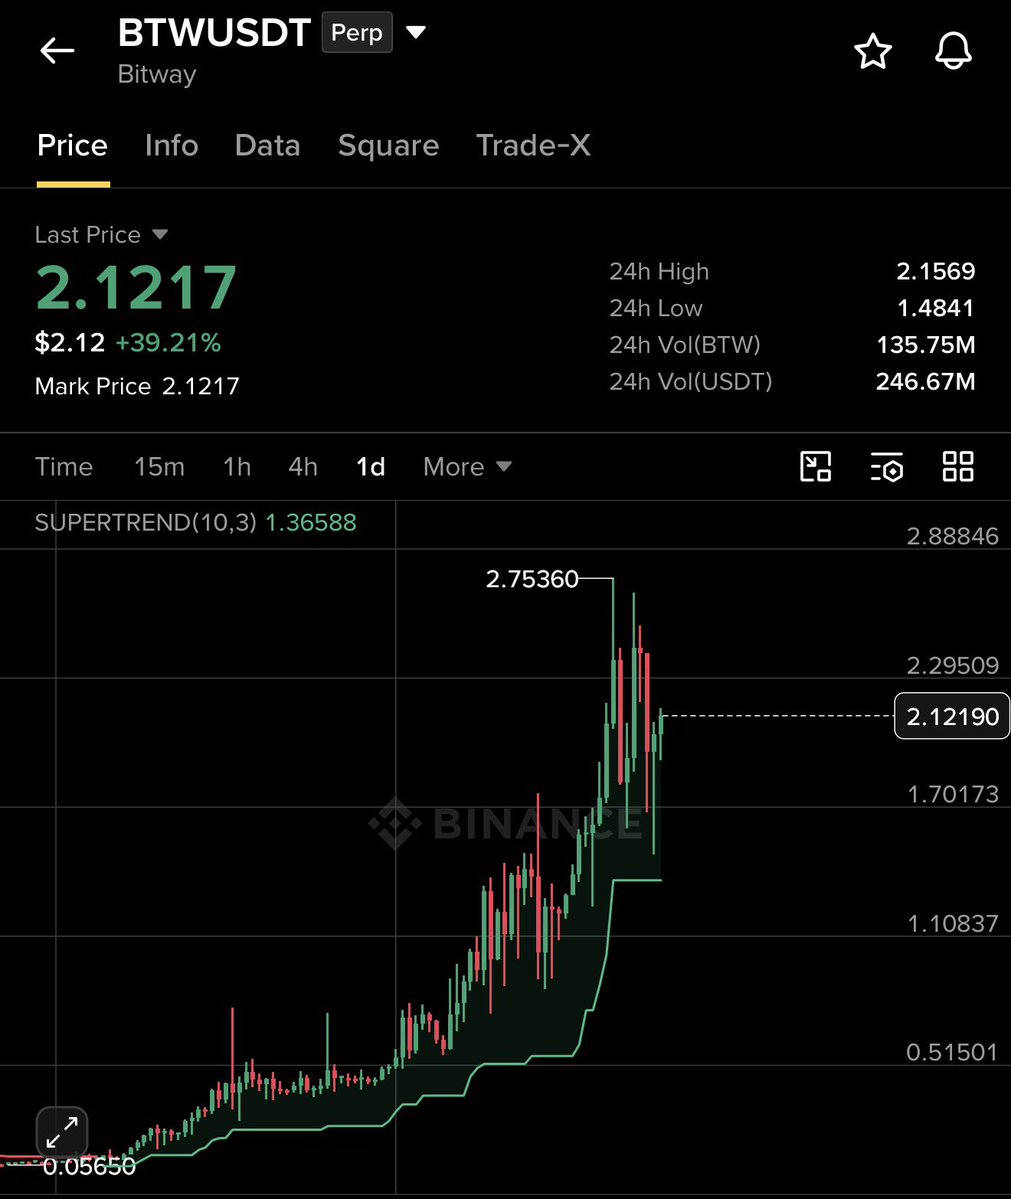
What do you think guys $BTW cross high attached? NFA
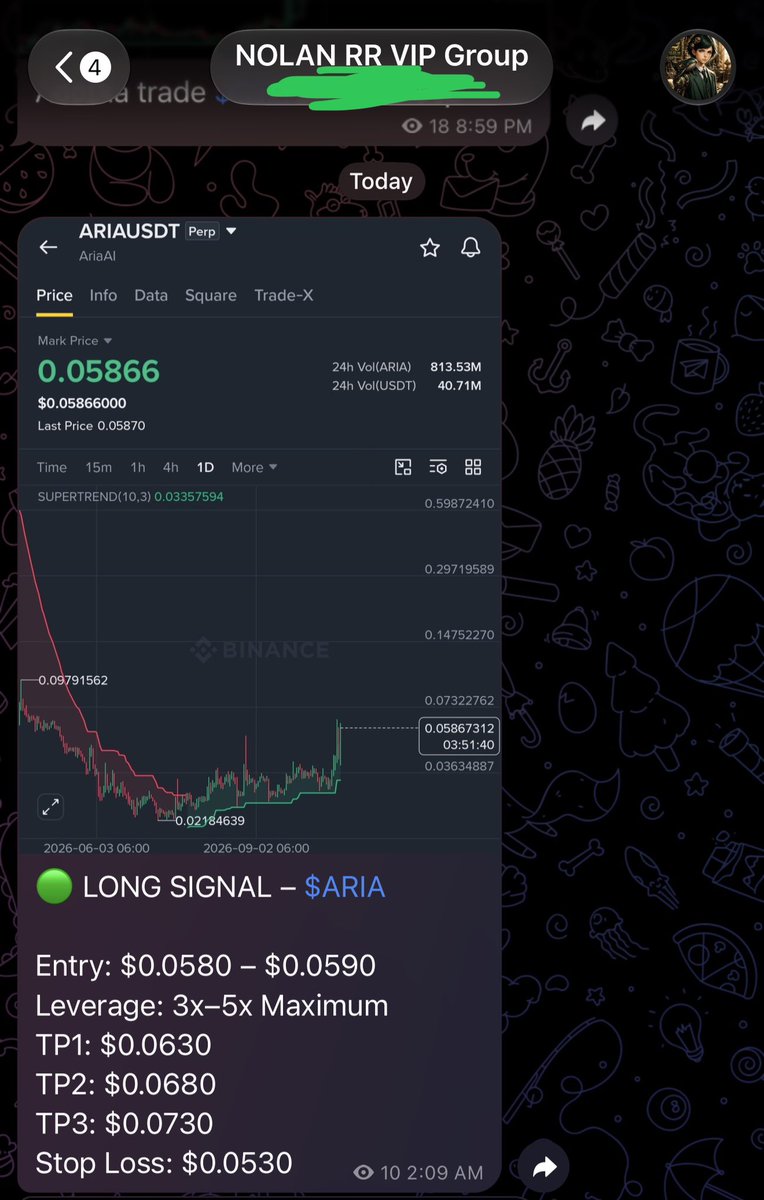
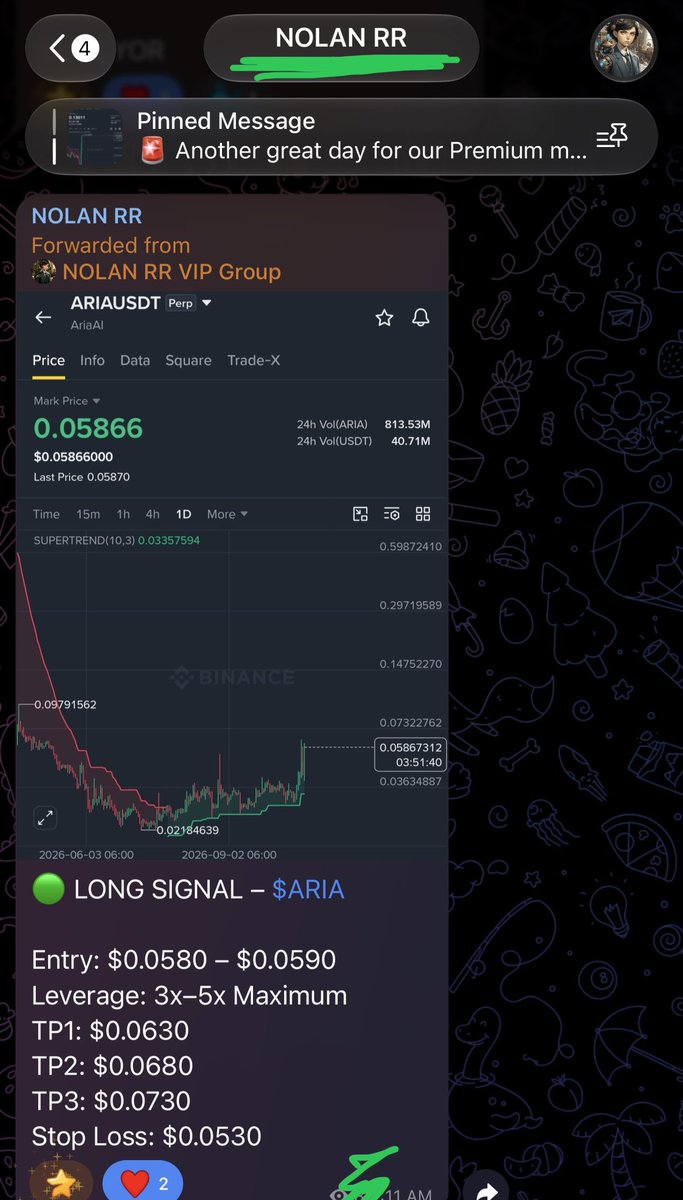
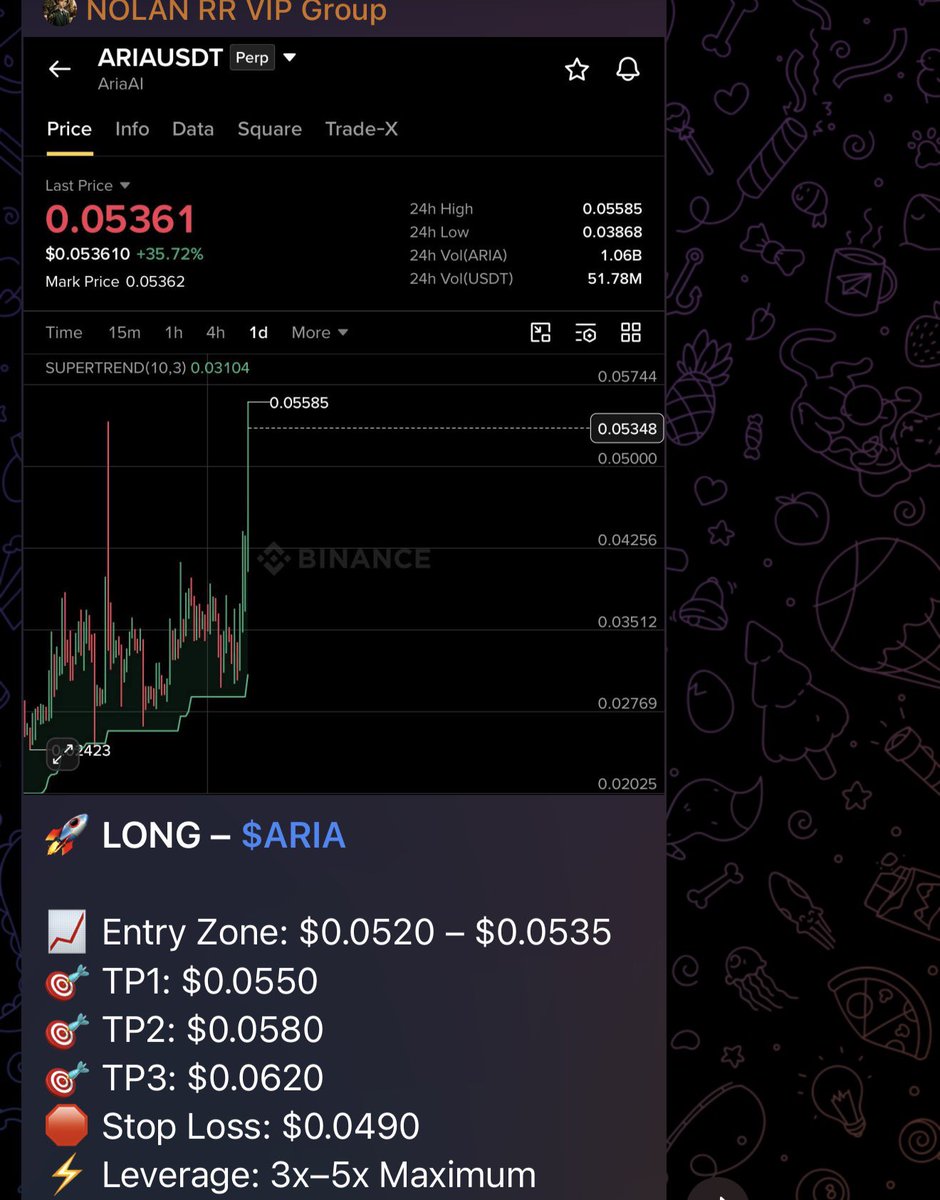
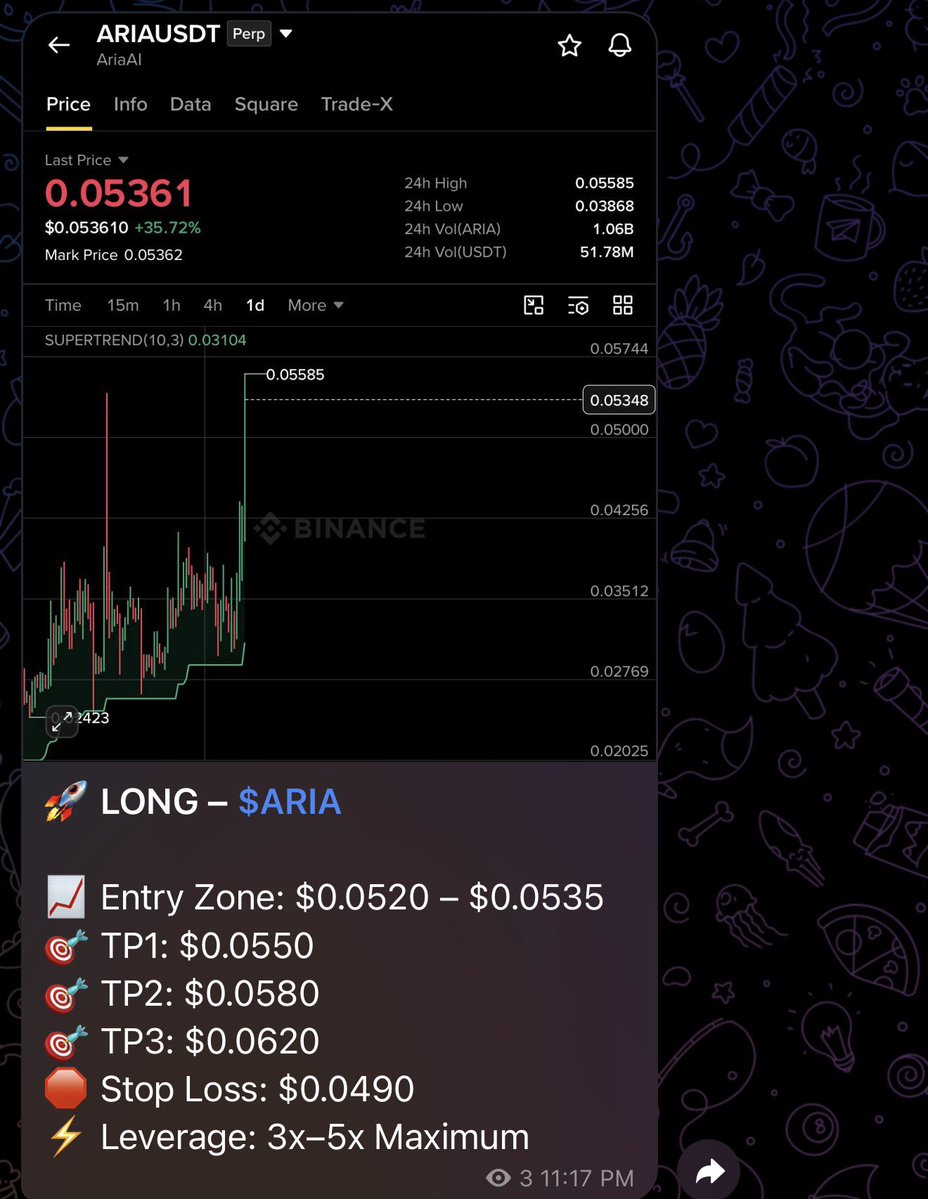
🚀 Another Signal Shared, Another Hit! So guys, I shared the $ARIA LONG signal in both my free group and premium group. Now, we’re seeing the move play out .📈🔥 I believe consistency and proper risk management matter more than chasing every pump. More opportunities ahead for the community! Stay tuned for the next setup 👀 NFA. DYOR
I found a another gem like $LAB 👀 NFA
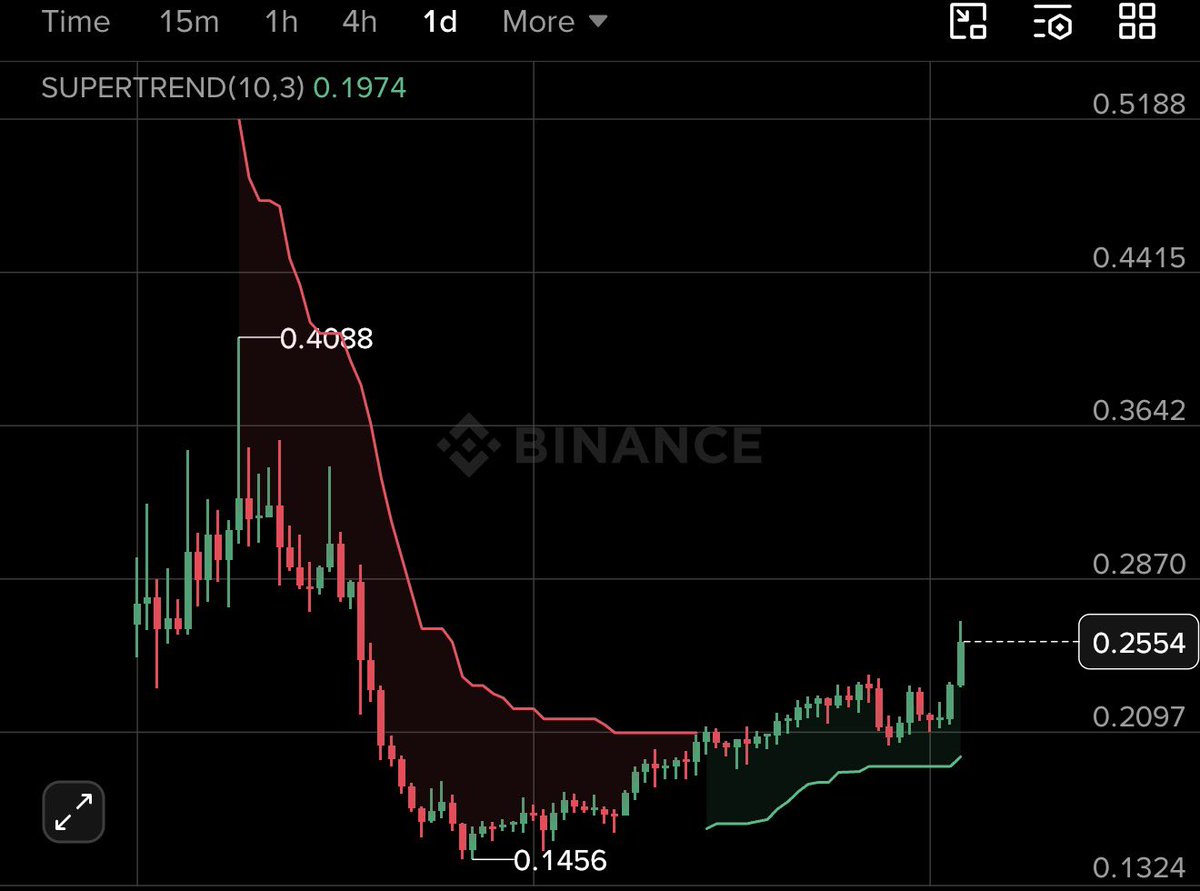
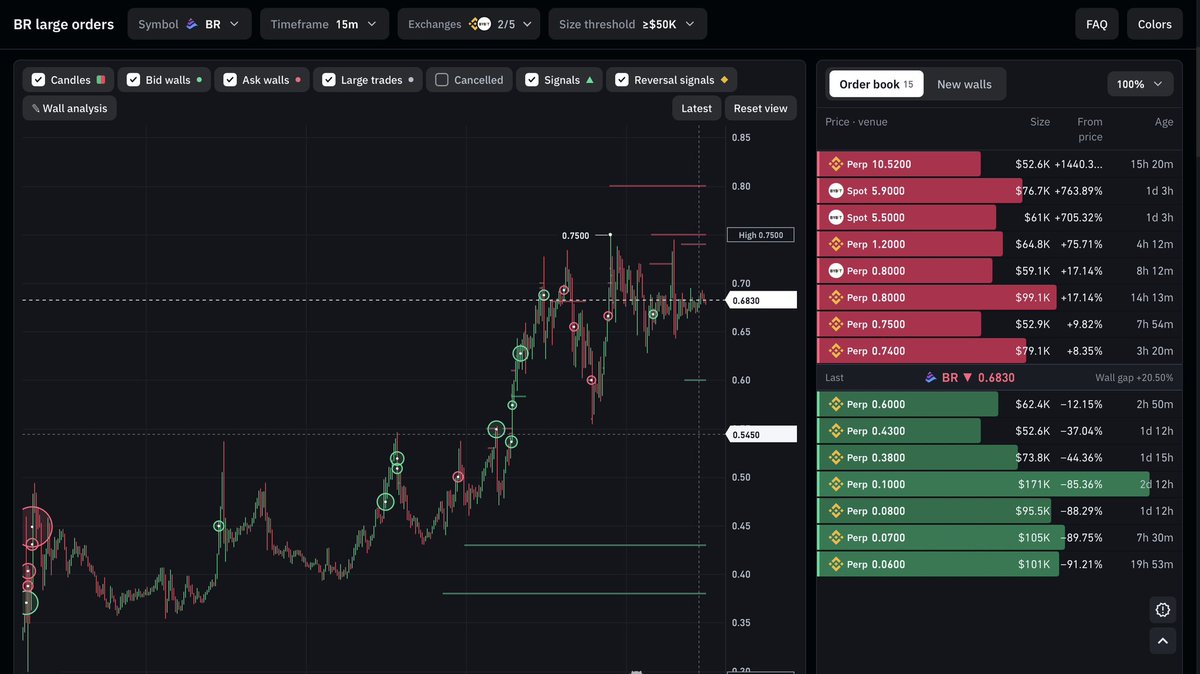
$BR is holding near $0.683 after a strong rally 👀 Buy walls around $0.60 and sell pressure near $0.74–$0.80 make these key levels to watch. A breakout above $0.75 could open the door to further upside, while losing $0.60 may trigger a deeper pullback. Will buyers push for another leg up, or will sellers take control? 👀 NFA. DYOR
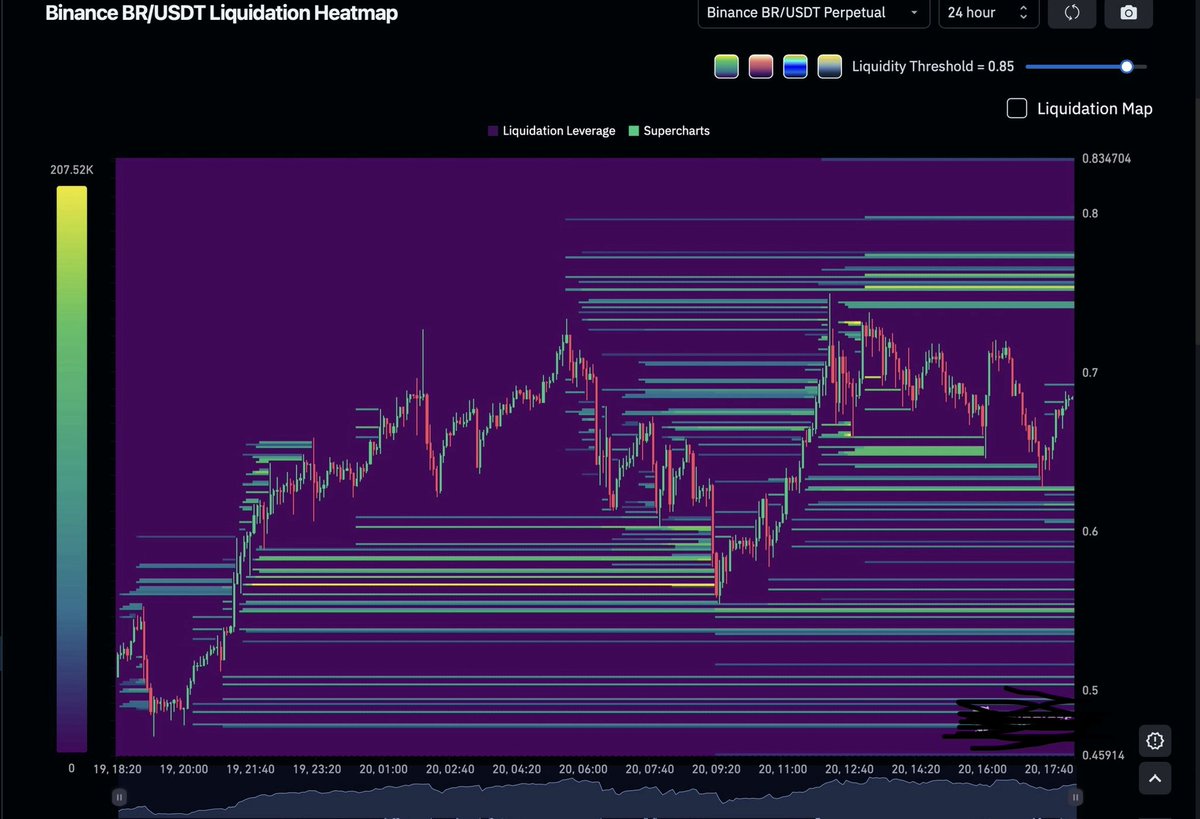
$BR Liquidity Map: A Bigger Move Could Be Coming 👀 $BR is trading around $0.68, with heavy liquidity sitting on both sides of the current price. 🟢 Above price: The $0.73–$0.78 zone has several liquidity clusters that could attract price if buying pressure continues. 🔴 Below price: The $0.62–$0.65 area holds liquidity, while $0.55–$0.60 could become important if sellers take control. My take is that $BR could make a sharp move toward one of these liquidity zones. A breakout is possible, but a liquidity sweep followed by a reversal is also on the table. Watch which side gets targeted first. 🎯 NFA. DYOR
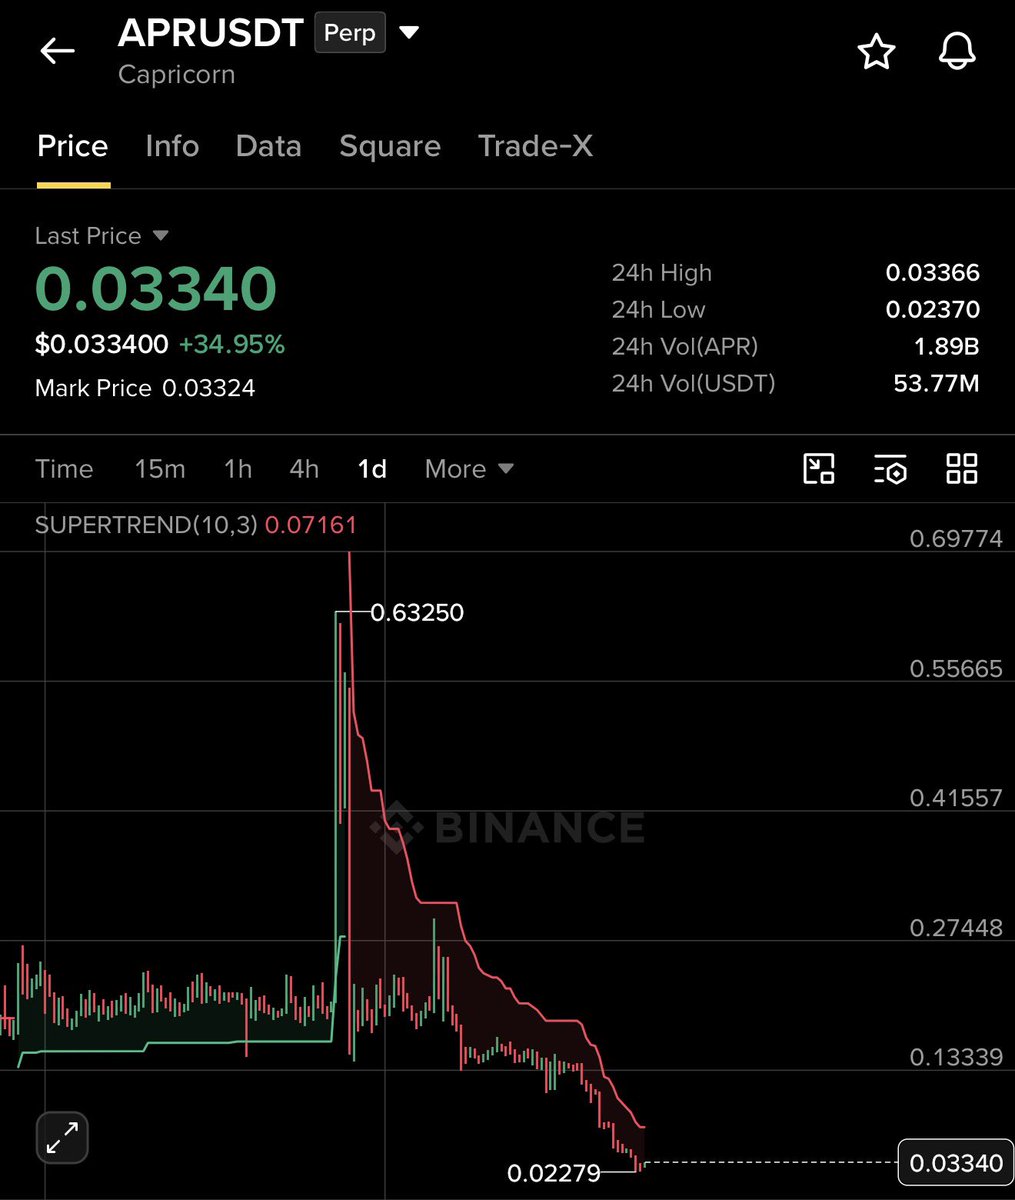
$APR looking bullish 👀 NFA
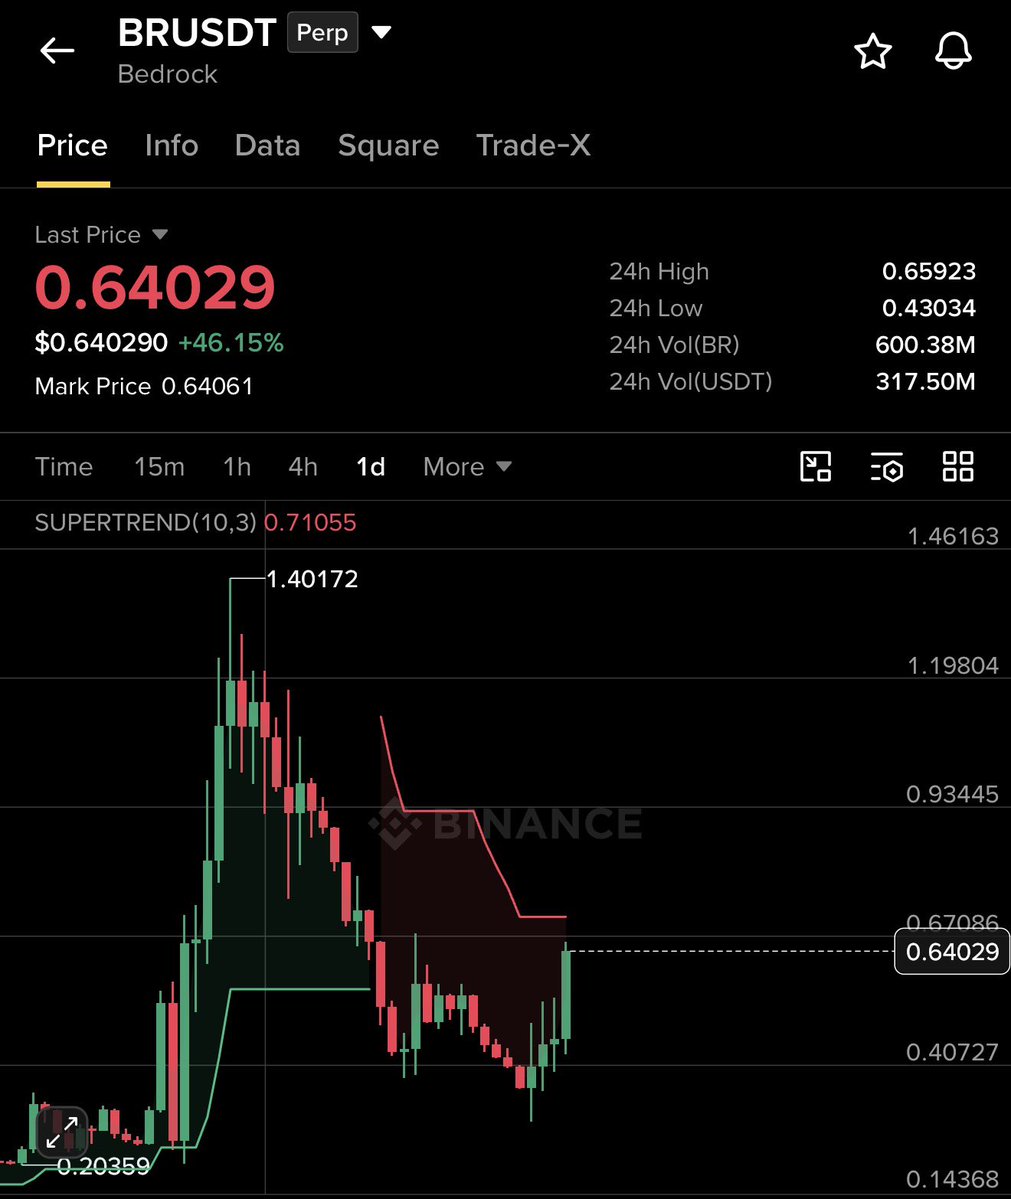
$BR 1$ coming guys What do you think? NFA
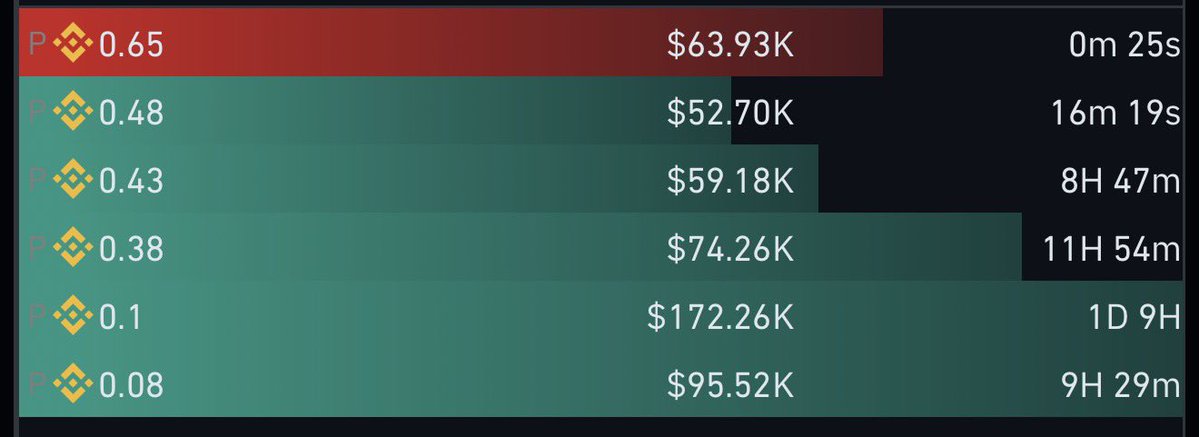
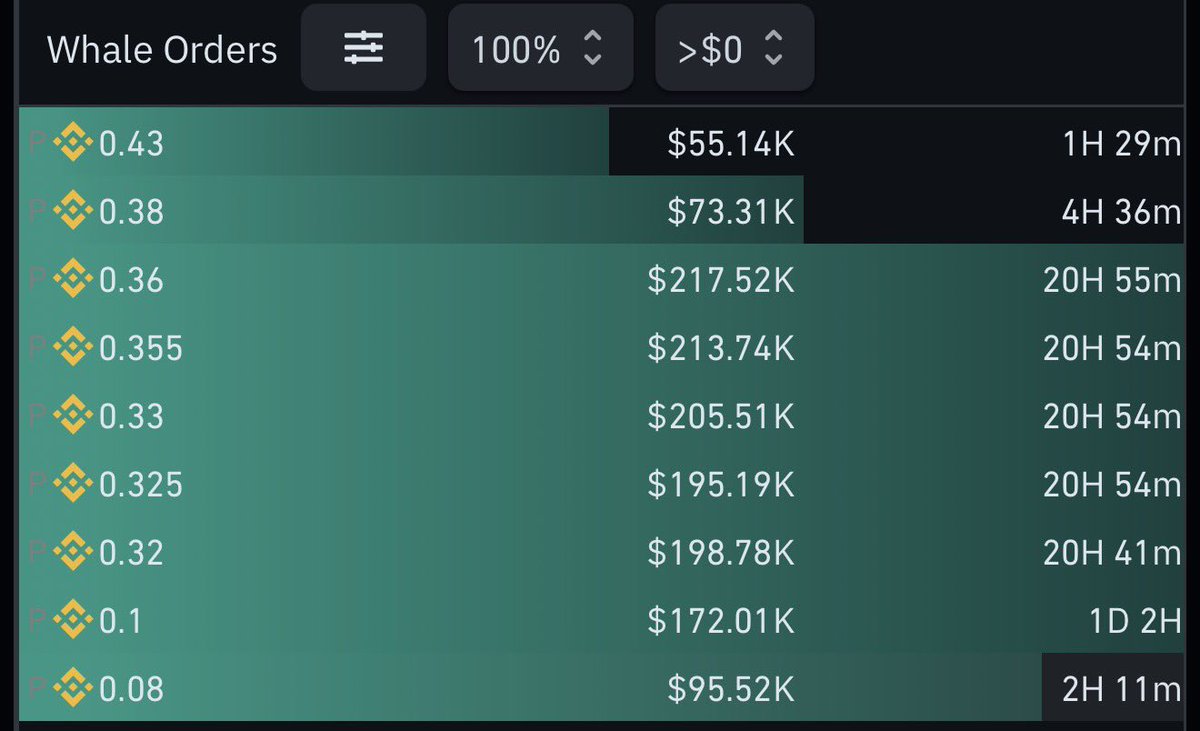
$BR bulls are still in control 🟢 So guys, we can see only one sell order around $0.65, while multiple buy orders are stacked below. The strongest visible buy wall is around $0.10 with $172K, followed by $0.08 with $95K. This suggests buyers may still be supporting $BR, but watch whether the sell pressure increases. 👀 NFA. DYOR
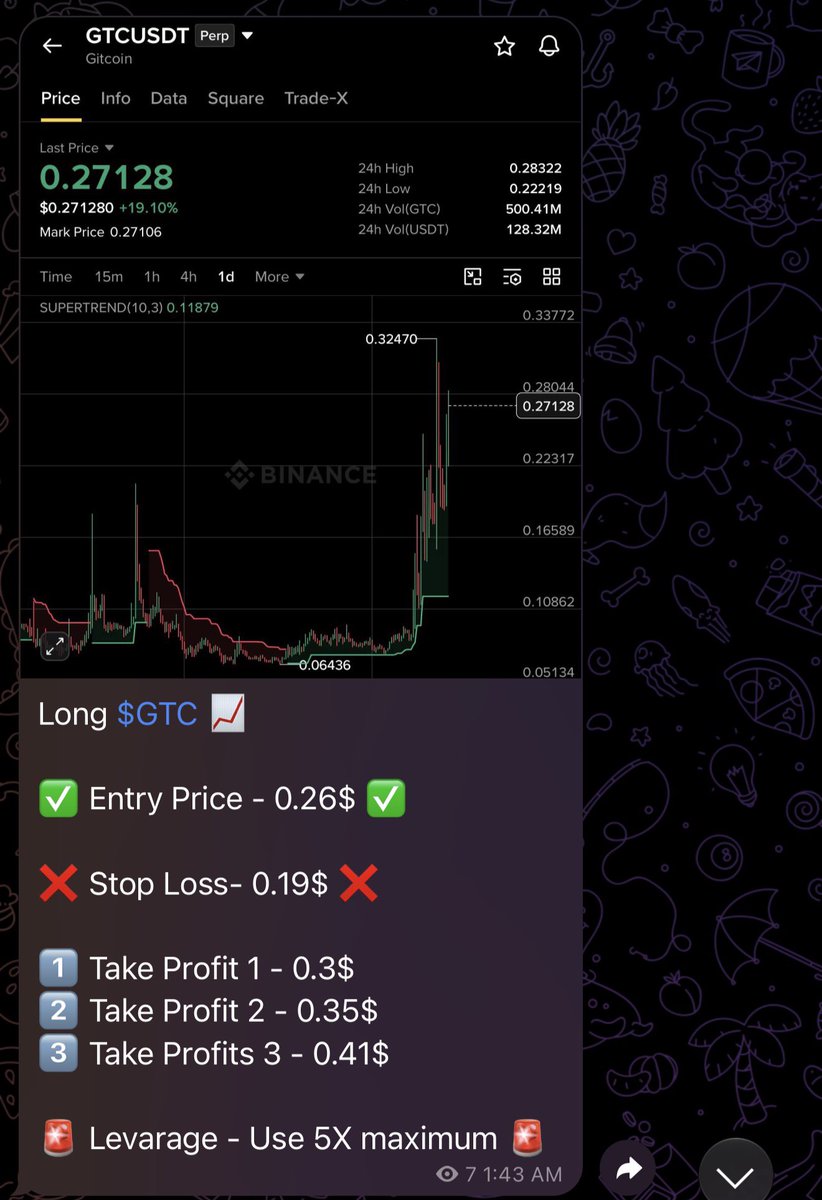
Today, I shared 3 signals in my VIP group, and all 3 hit their take-profit targets! 🎯 $GTC | $BR | $ARIA NFA. DYOR
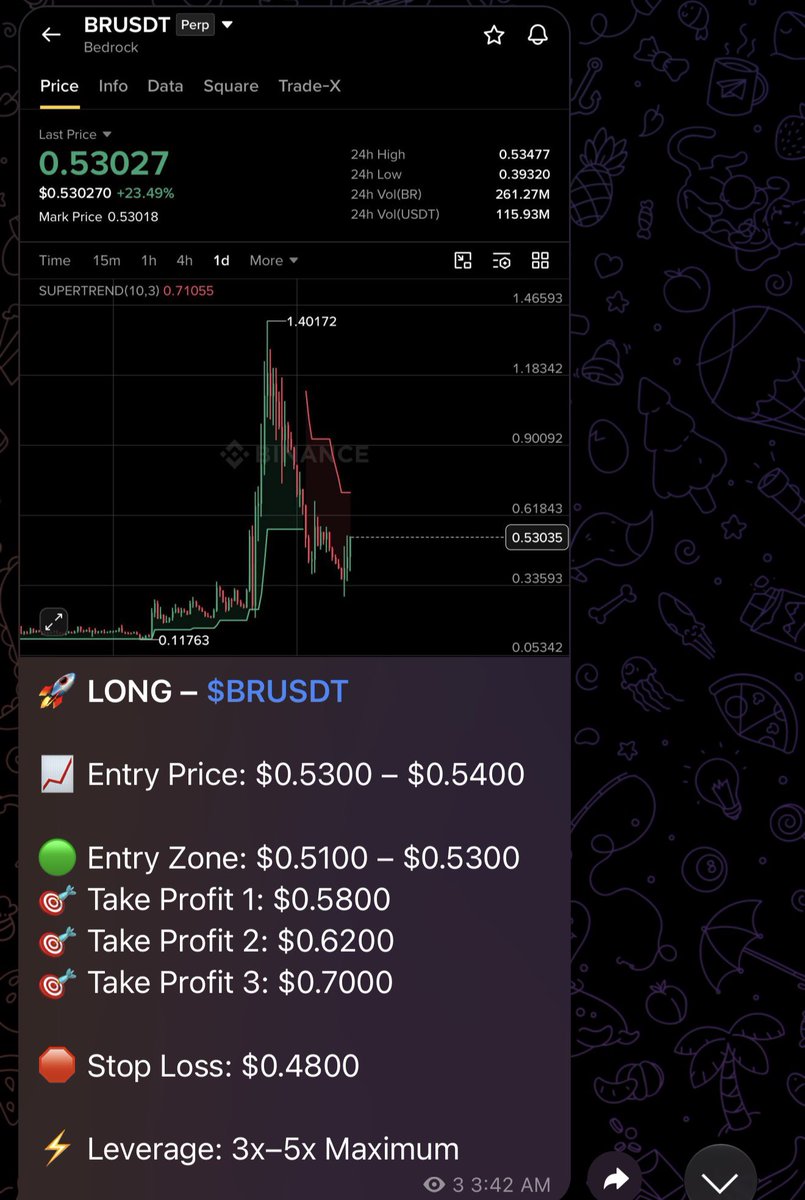
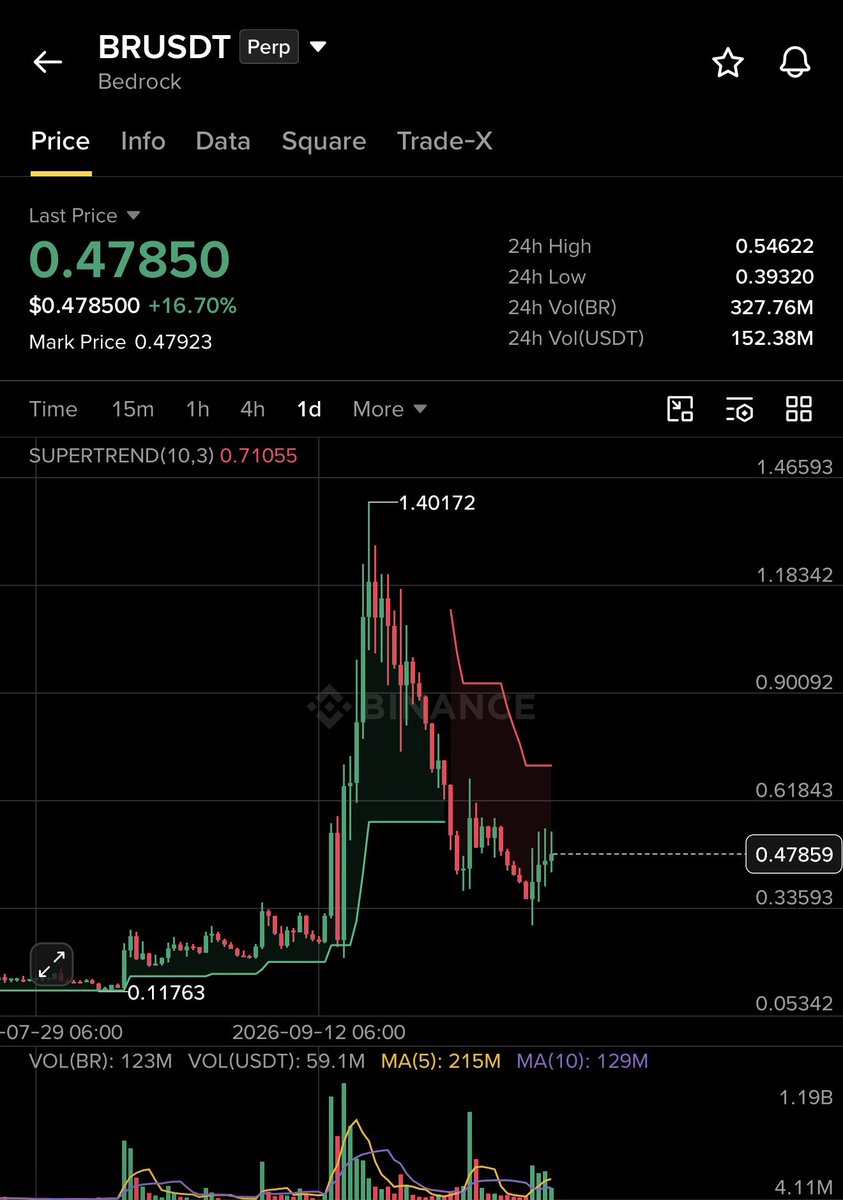
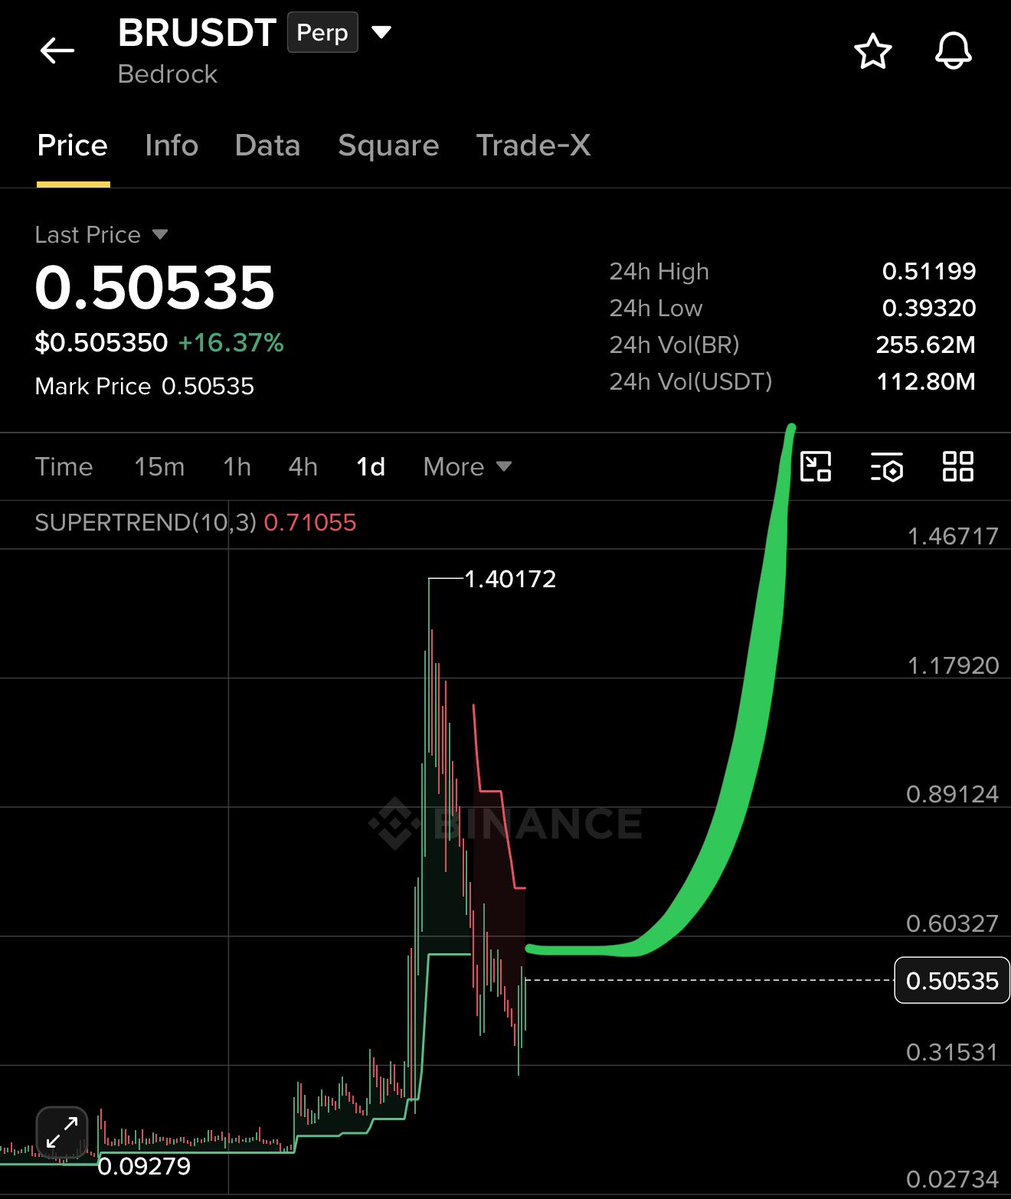
$BR is showing a short-term recovery after a massive correction from $1.40 to the current $0.4785. 📊 The price is up 16.7% in 24 hours, but the daily Supertrend remains bearish at $0.7105. If buyers regain momentum, $0.55 and $0.62 could be the next resistance zones. However, losing the $0.39 support could trigger another downward move. Watch whether buyers can sustain this bounce before assuming a full trend reversal. NFA. DYOR
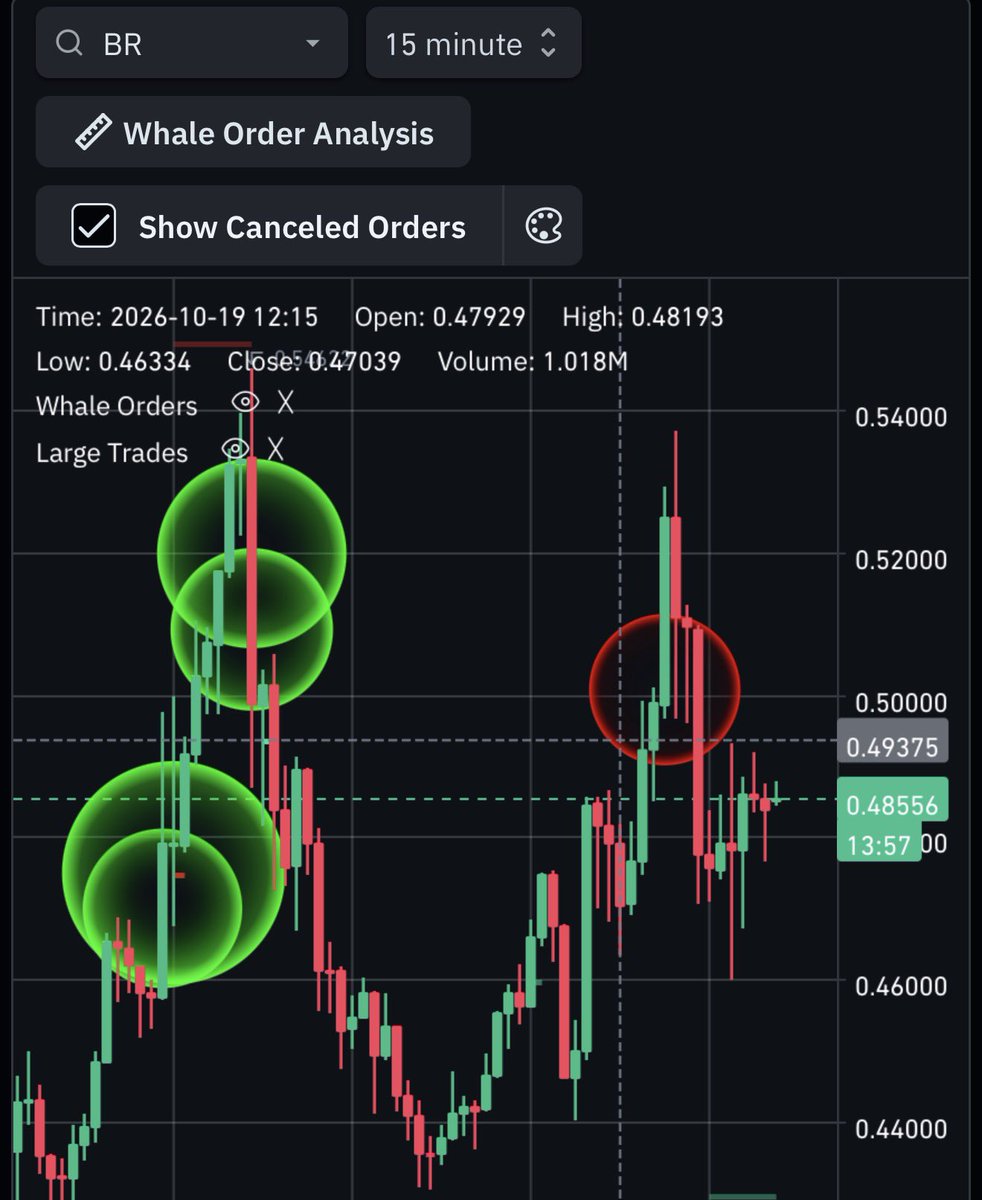
Good news for $BR holders .🟢 Whale orders show significant buy orders around $0.36–$0.43, while $BR is currently trading near $0.485. The $0.48 zone is worth watching as buyers try to defend the price. If buying pressure continues and $BR breaks above $0.50–$0.51, we could see another move upward. However, large orders can be canceled, so confirmation is still important. Keep an eye on whale activity and price action. 👀 NFA. DYOR
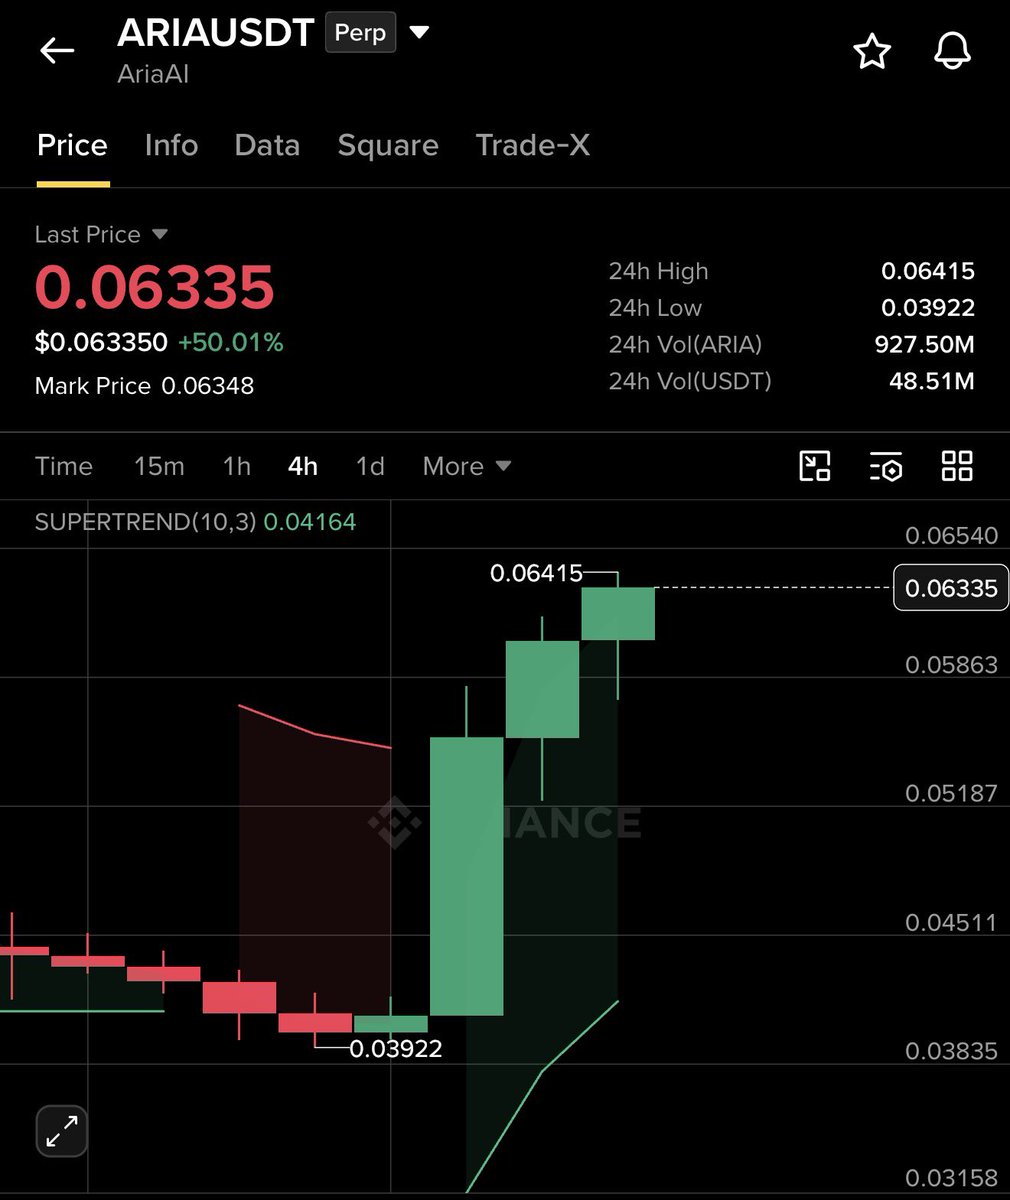
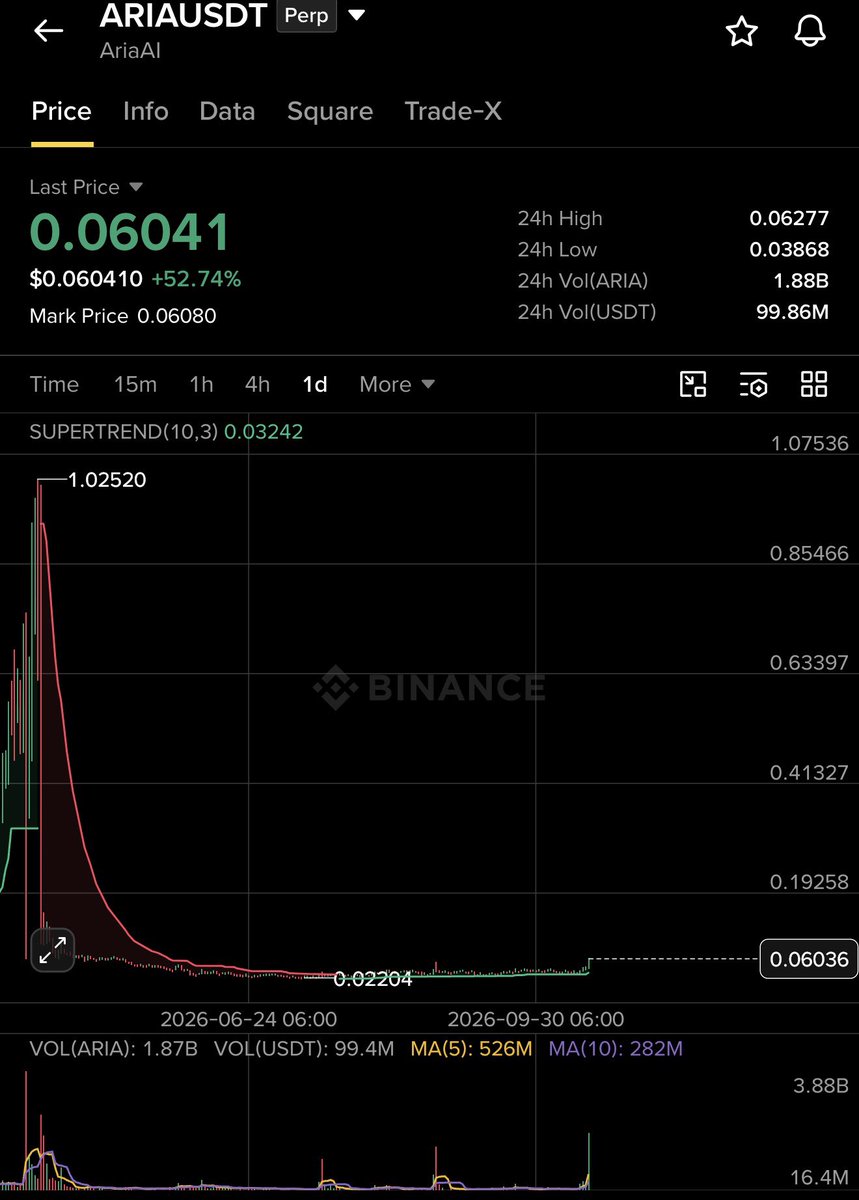
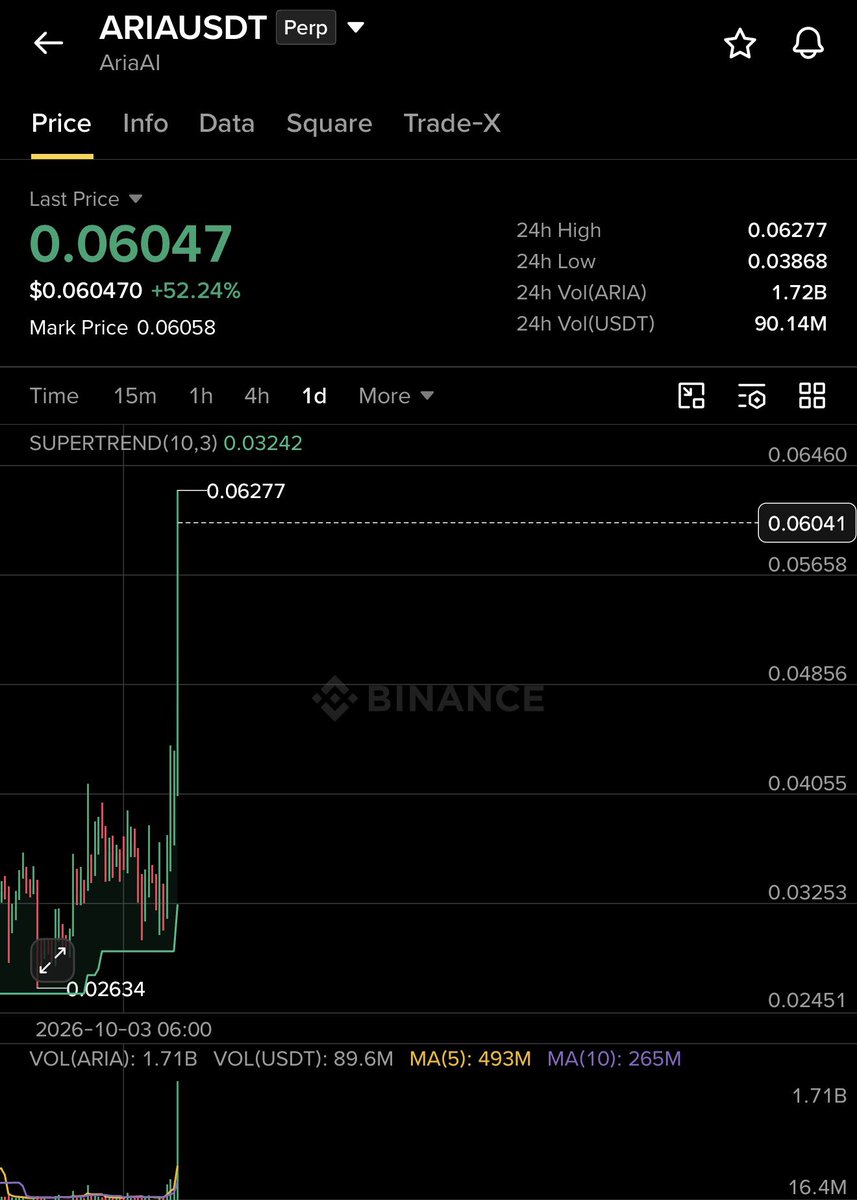
🚀 $ARIA Is Showing Strong Momentum After a Long Downtrend So guys, $ARIA is up 52.74% in the last 24 hours, with trading volume reaching nearly 99.86M USDT. After staying near the bottom for a long time, the token is finally showing a strong breakout attempt. 📈 Bullish Scenario: If $ARIA holds above $0.060, buyers could push the price toward $0.06277 and potentially higher. ⚠️ Bearish Scenario: After such a sharp move, profit-taking could trigger a pullback. If buying pressure fades, the breakout may not sustain. The volume spike is worth watching, but one green candle doesn’t confirm a long-term recovery. Can $ARIA maintain this momentum? NFA. DYOR.
$BR looking bullish! What do you think
😂😂 as I told you guys now see just 10 min $ARIA hit our 3rd TP
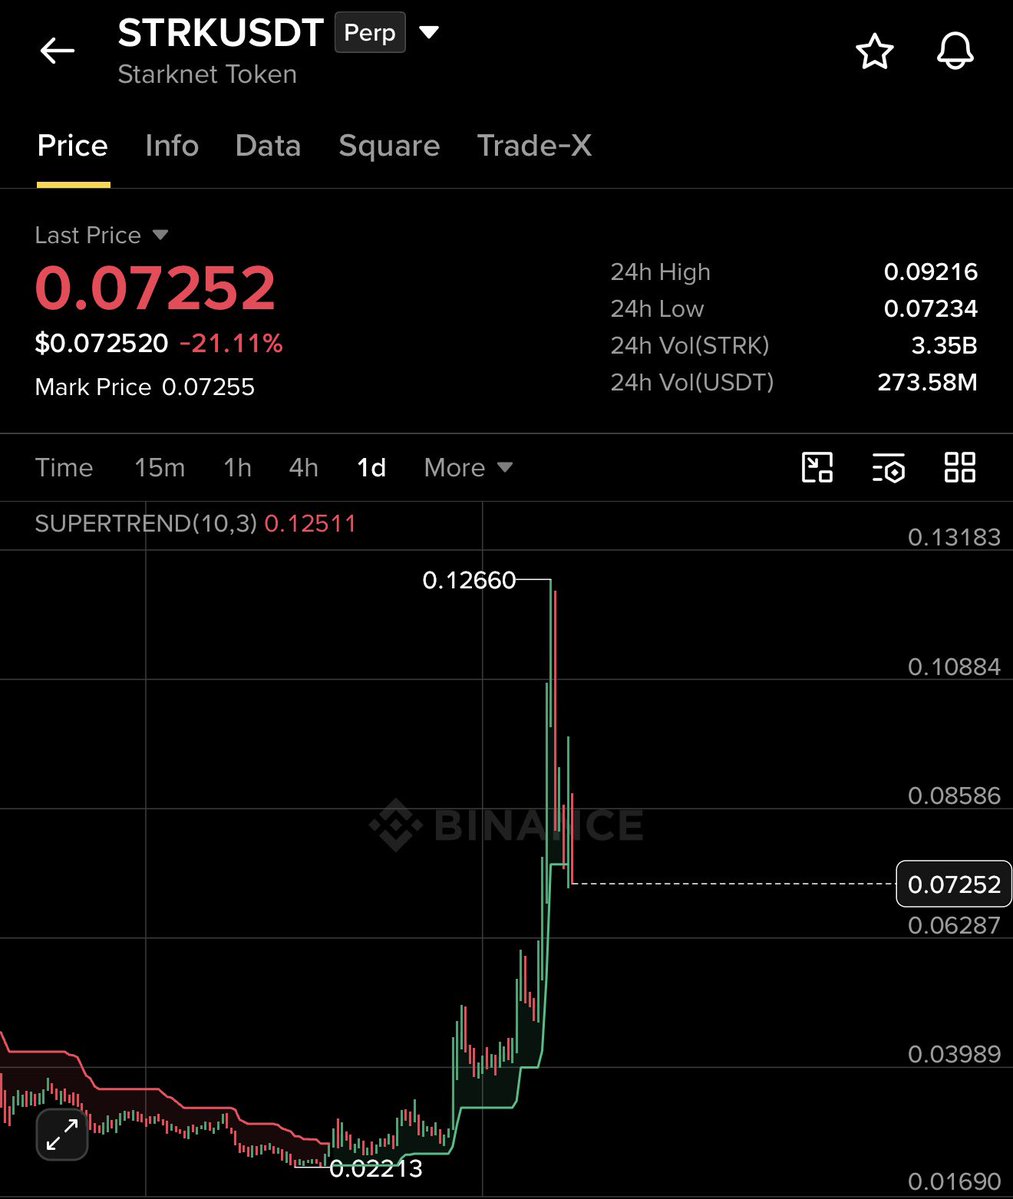
📉 $STRK Is Facing Heavy Selling Pressure $STRK has dropped 21.11% in the last 24 hours after a massive rally toward $0.1266. Sellers are now taking control as the price falls to $0.07252. 📊 24H Volume: $273.58M 🔴 24H High: $0.09216 🟢 24H Low: $0.07234 The price is trading below the Supertrend level at $0.12511, suggesting the bearish trend remains strong. High volatility after the sharp pump shows that traders are still fighting for direction. ⚠️ Key levels to watch Support: $0.0723, then $0.0628 Resistance: $0.0858, then $0.0922 If $STRK breaks below $0.0723, further downside is possible. A recovery above $0.0858 could bring some relief, but confirmation is needed before expecting a stronger bounce. Stay cautious and watch the next price reaction 👀