
How many active/conditional orders can I view on my Last Traded Price chart?
Traders can place 500 active orders, 10 conditional orders, and 20 TP/SL orders. The maximum number of active and/or conditional orders that can be viewed on your chart is limited to 100. Any subsequent orders placed (101st order onwards) will overwrite the display of the oldest order shown on the price chart.
For example, order numbers 1 to 100 will be shown on the price chart as well as inside the Current Orders tab. If the 101st and 102nd active orders are successfully placed, only order numbers 3 to 102 will be shown on the price chart.
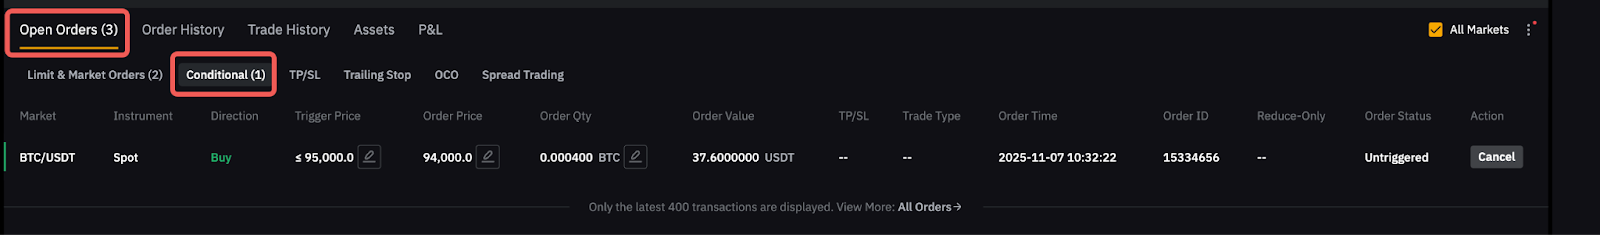
Can I amend my orders directly on the chart?
Yes, you can amend orders by dragging the price line of your limit or conditional order. However, please be aware that this is limited to the changing of order price or trigger price for active limit orders or conditional orders respectively. To change the order price of your conditional order, you can go to the Open Orders → Conditional tab.
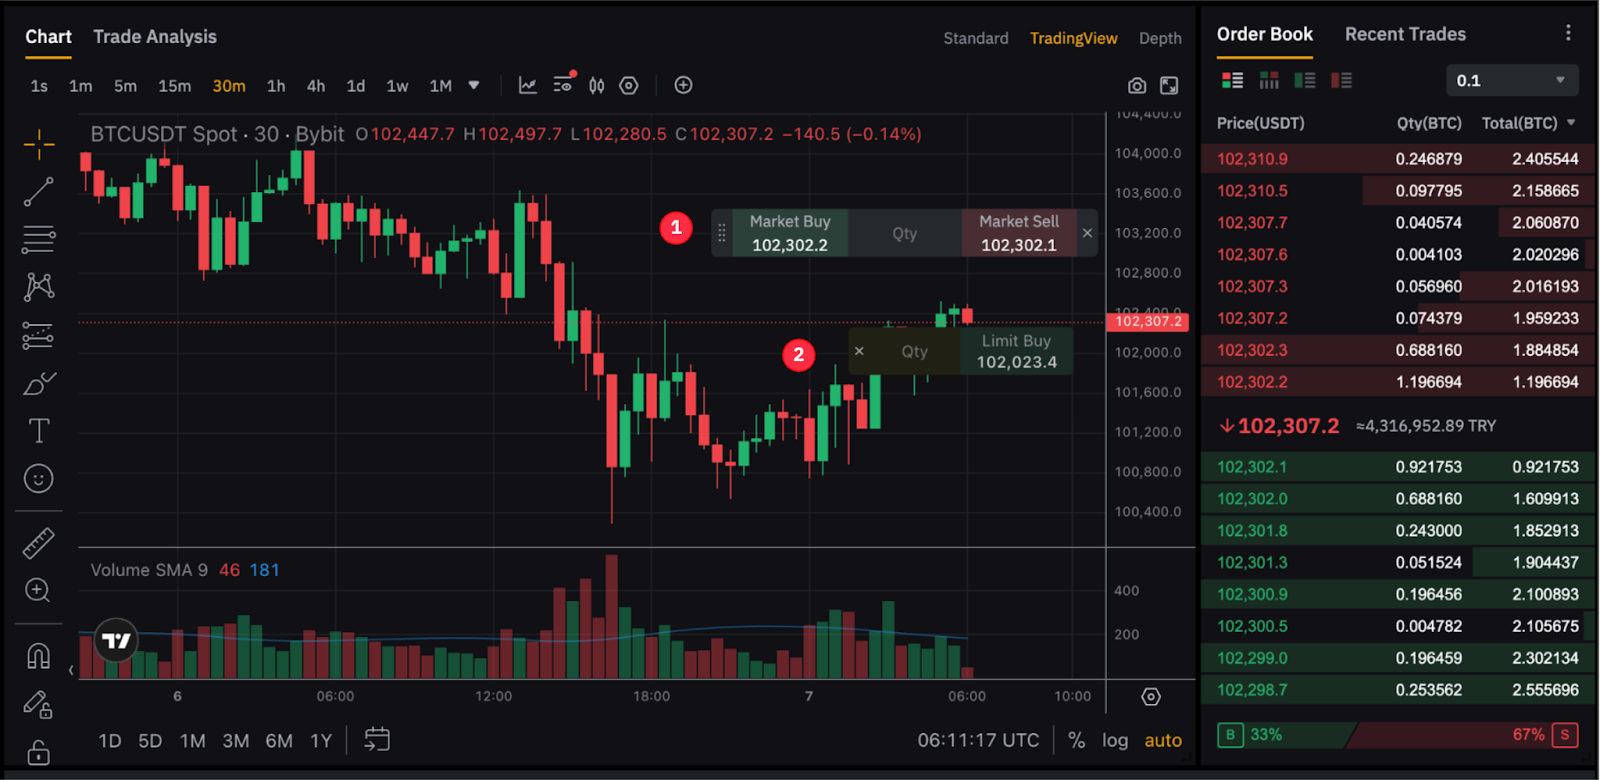
What are the quick trading features?
There are two (2) types of quick trading features currently only available on the Bybit TR website.
1. Quick Trading - Market Order
2. Quick Trading - Limit Order
For more information, please refer to Introduction to Quick trading Features.
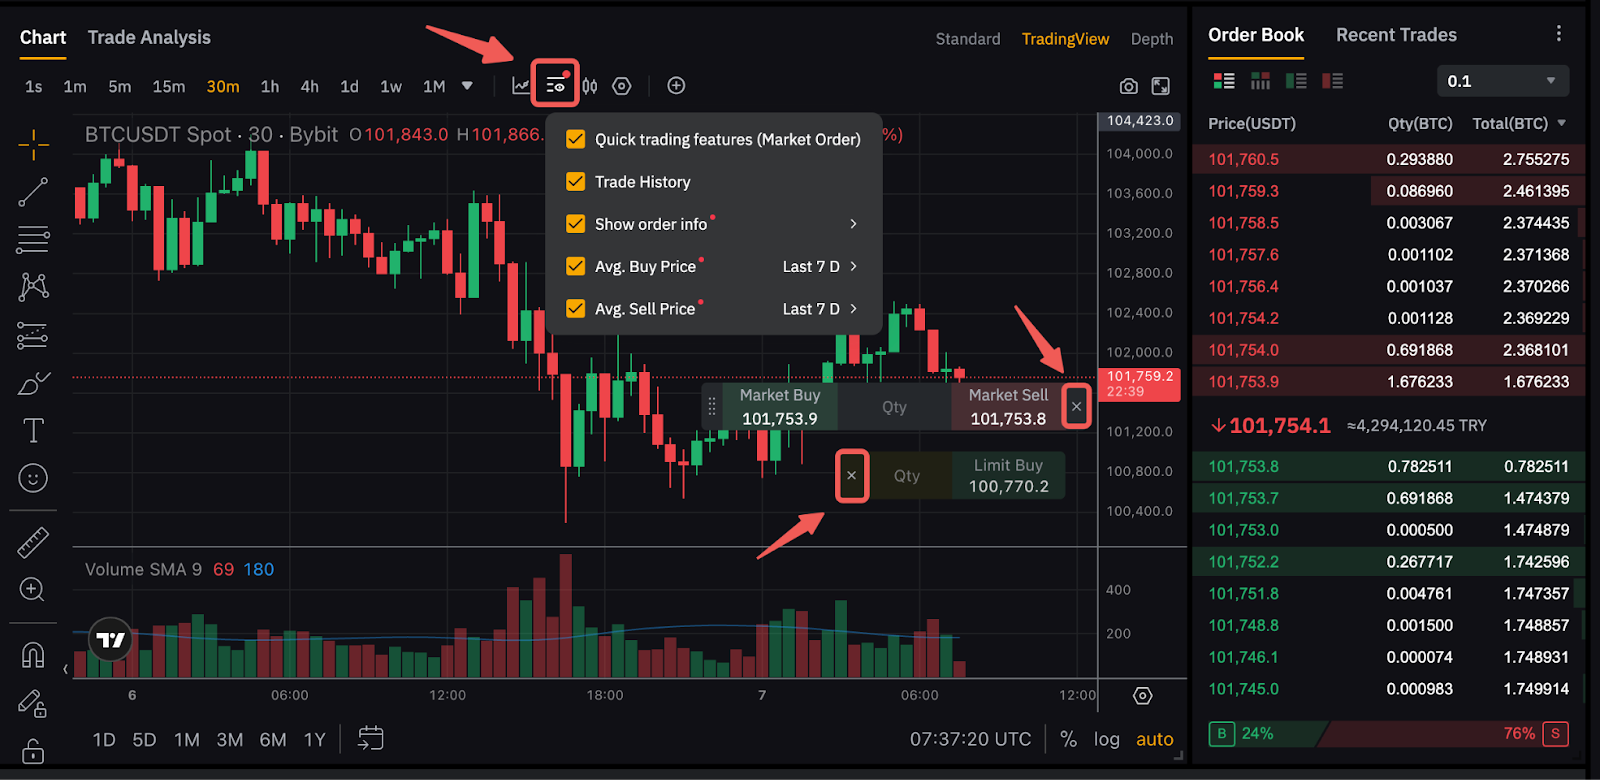
How do I turn on/off Quick trading features?
You can enable the Quick trading features in the following ways:
-
To trade with the Quick Market Order, simply click on the Display icon on the chart menu and check the Quick trading features (Market Order) option.
-
To open a Quick Limit Order, you can click on your preferred price on the right-hand side of the chart and input your desired quantity in the available box.
To turn off the feature, you can click on the Close button next to each of the trading boxes.
Can I view my Trading Bot orders on the LTP chart?
No. Currently, orders from Trading Bots will not show on the Trading Chart.
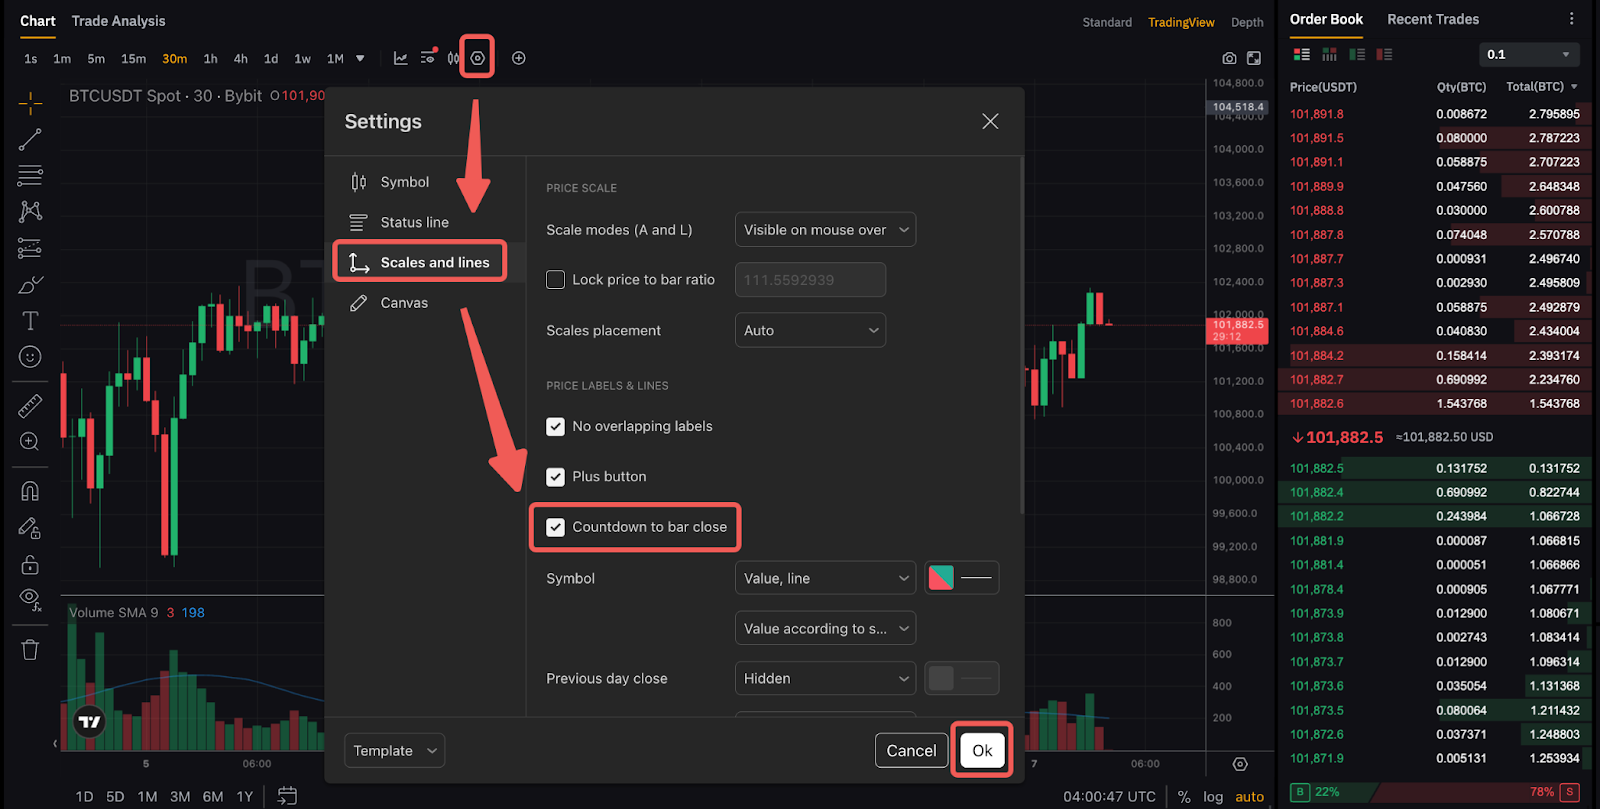
How do I enable the Countdown to Bar Close?
Navigate to Settings → Scales and Lines and tick on the Countdown to Bar Close box to enable it. This feature is currently only available on PC.
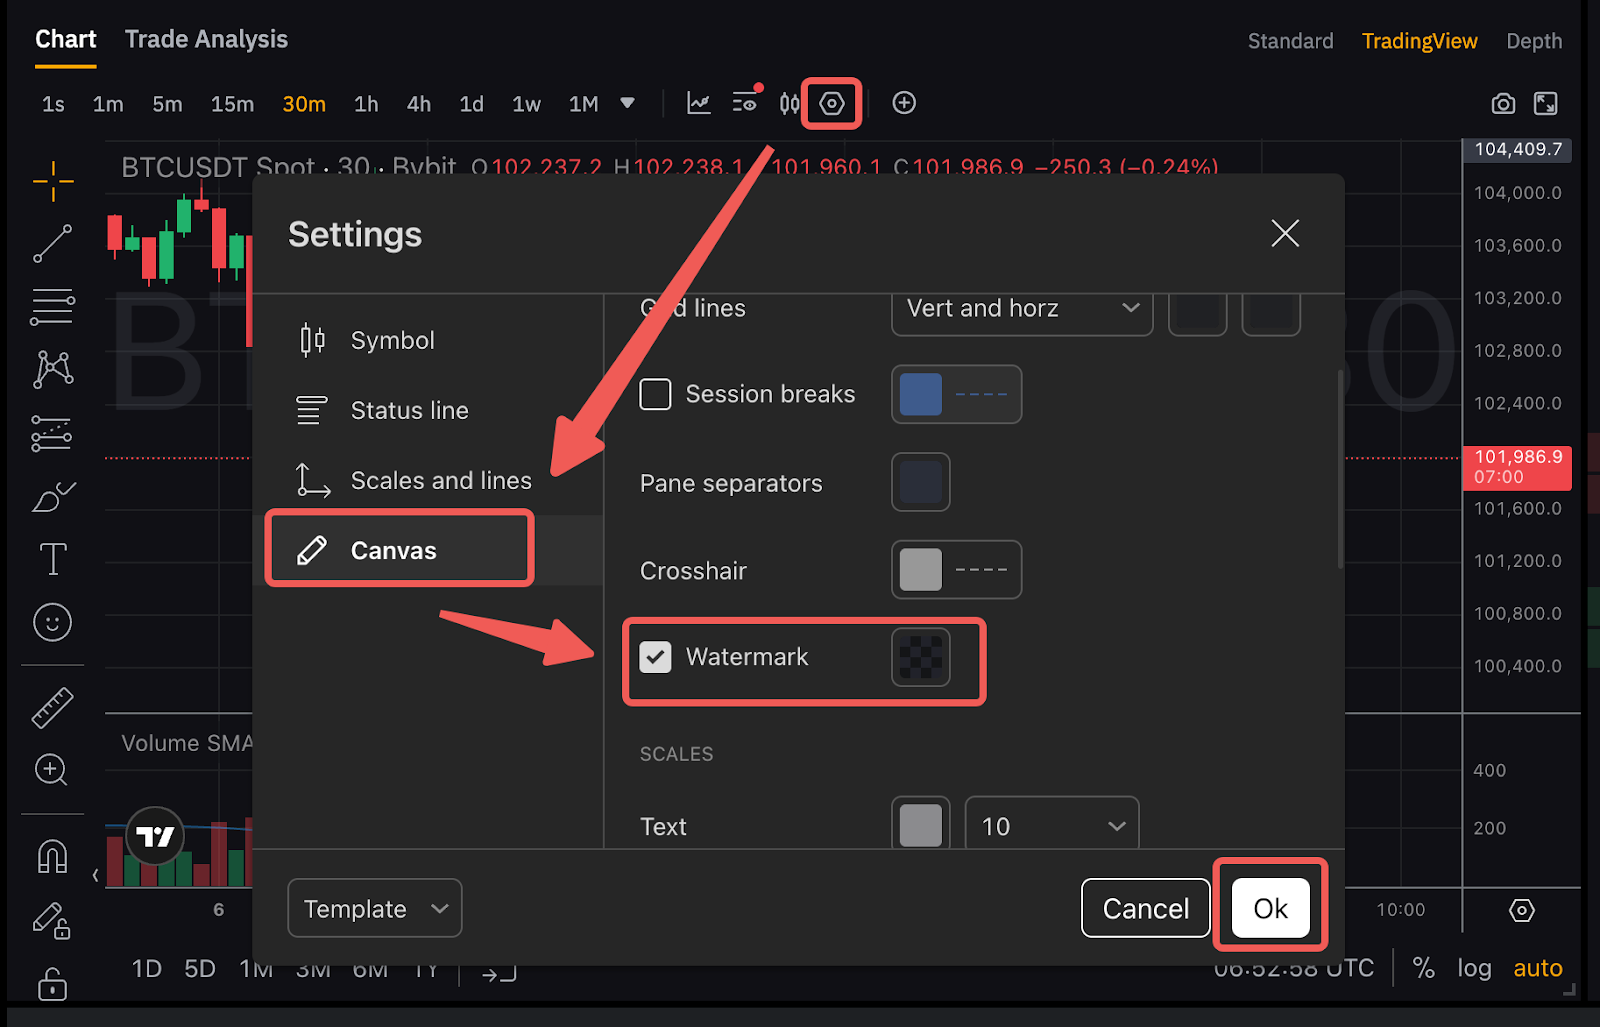
How do I remove the trading pair's background symbol on my trading chart?
Right-click within the chart area, then click on Settings → Canvas → uncheck the Watermark box and click on Ok.
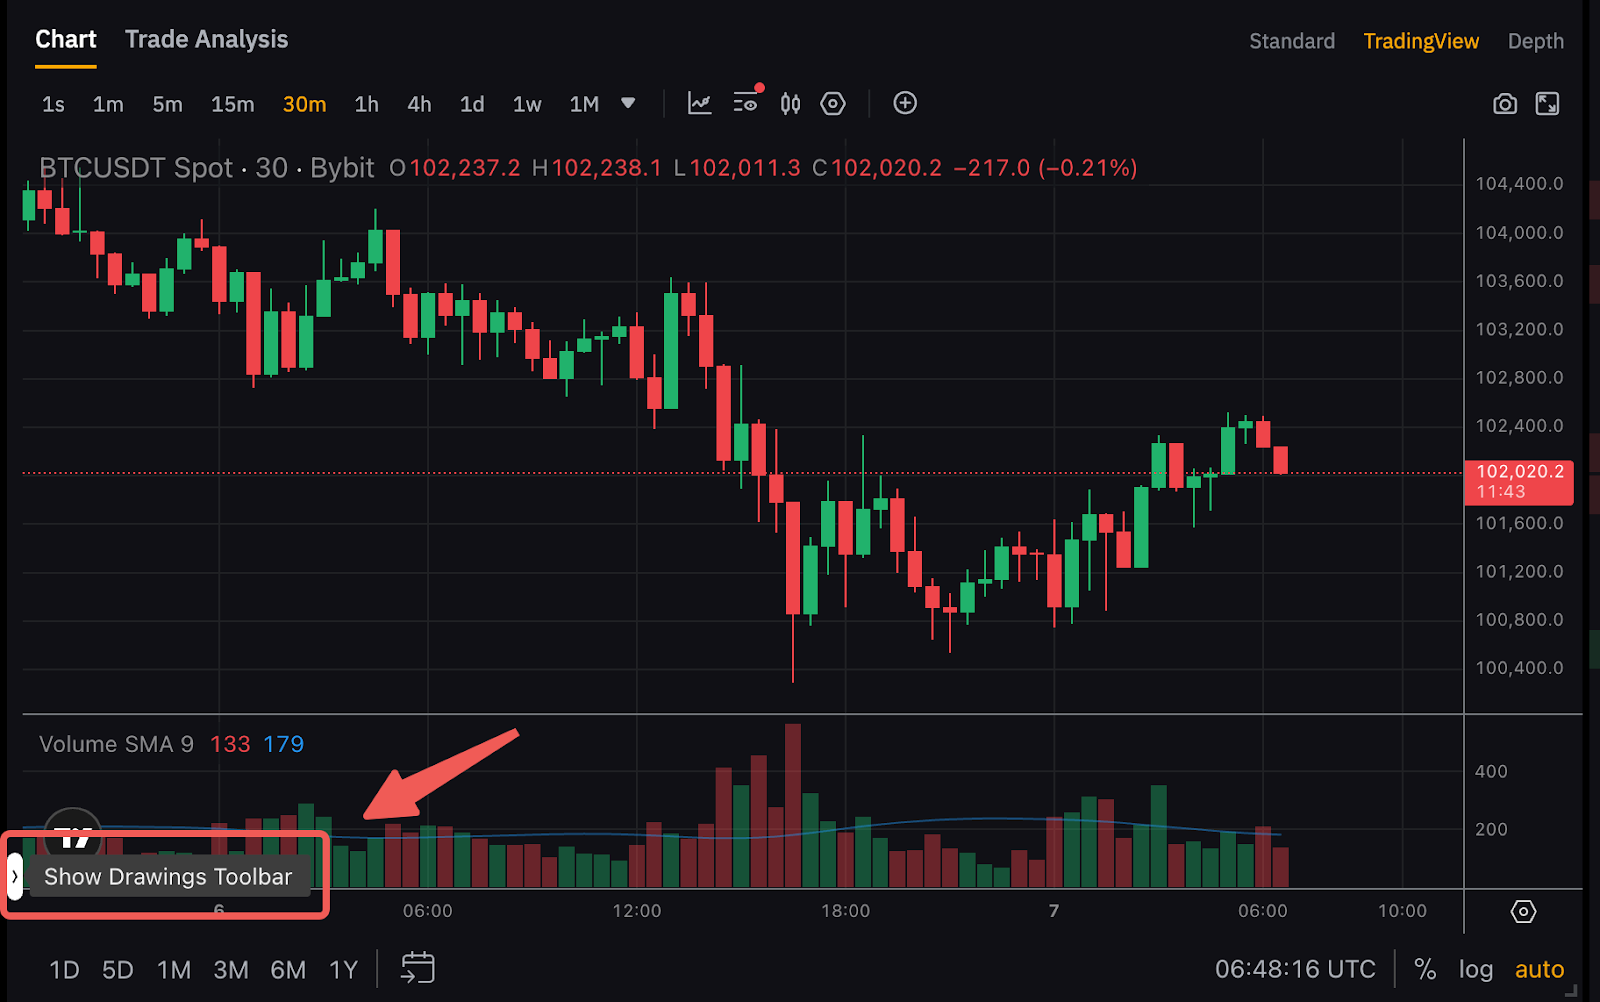
How do I turn on drawing tools?
You can enable the drawing tools from the lower left corner of the TradingView Chart.
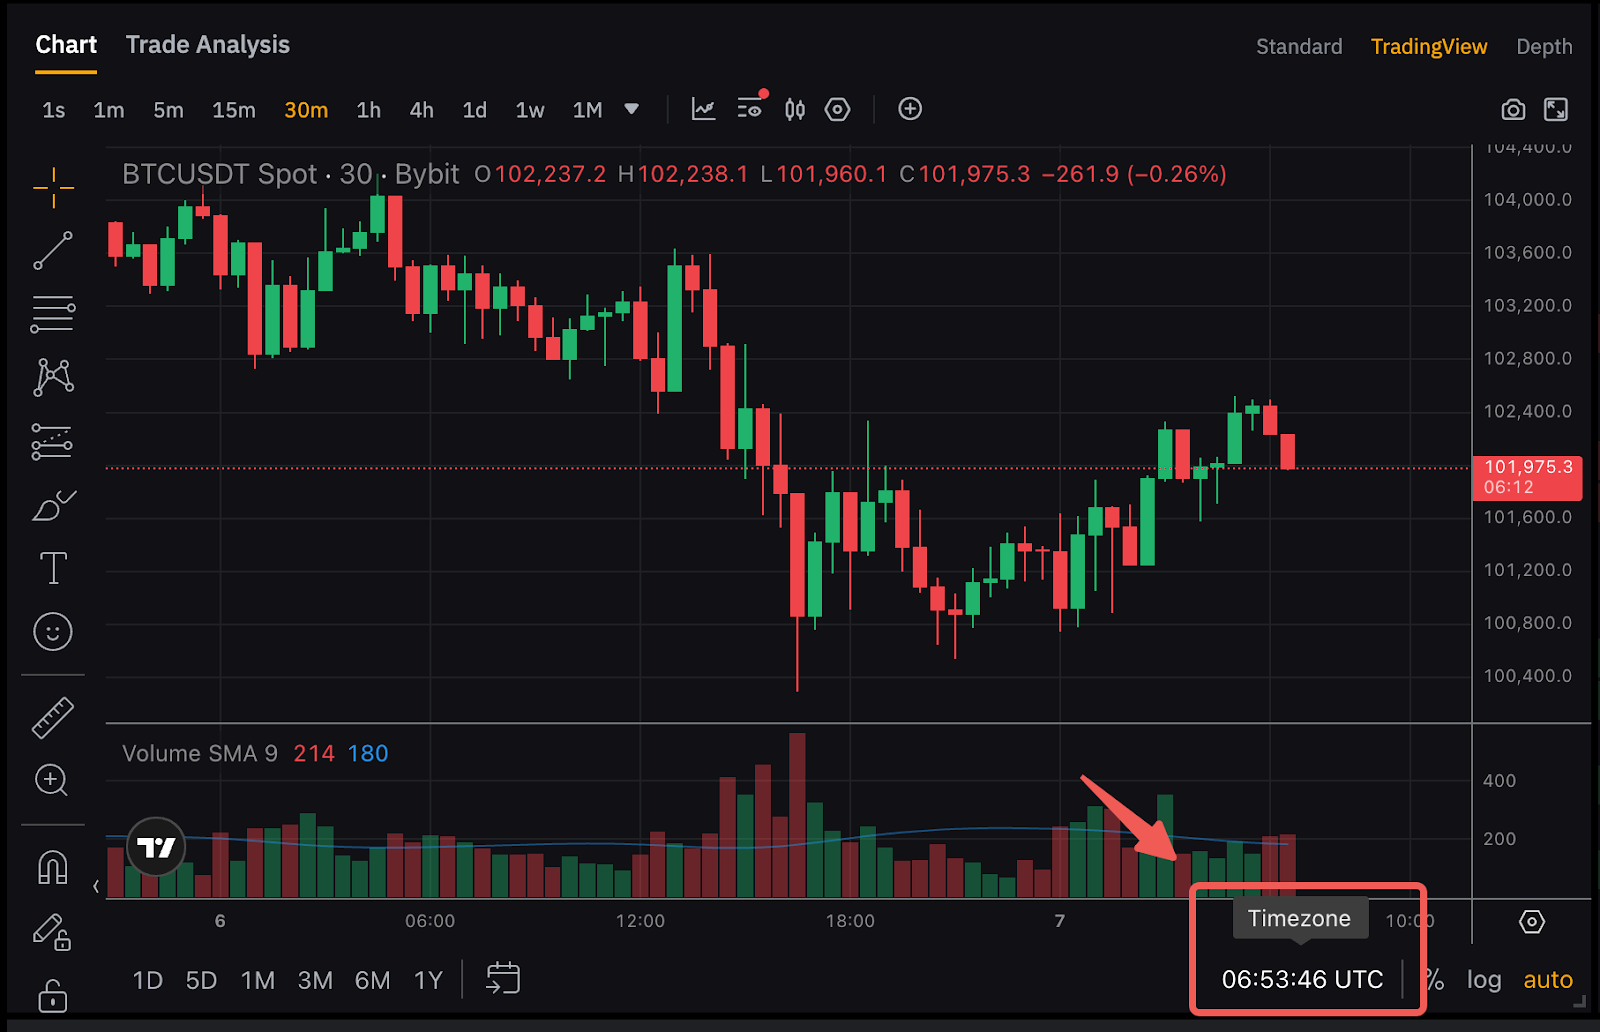
How can I adjust the chart timezone?
You may click on the time indicator at the bottom right corner of the chart to select your preferred timezone.
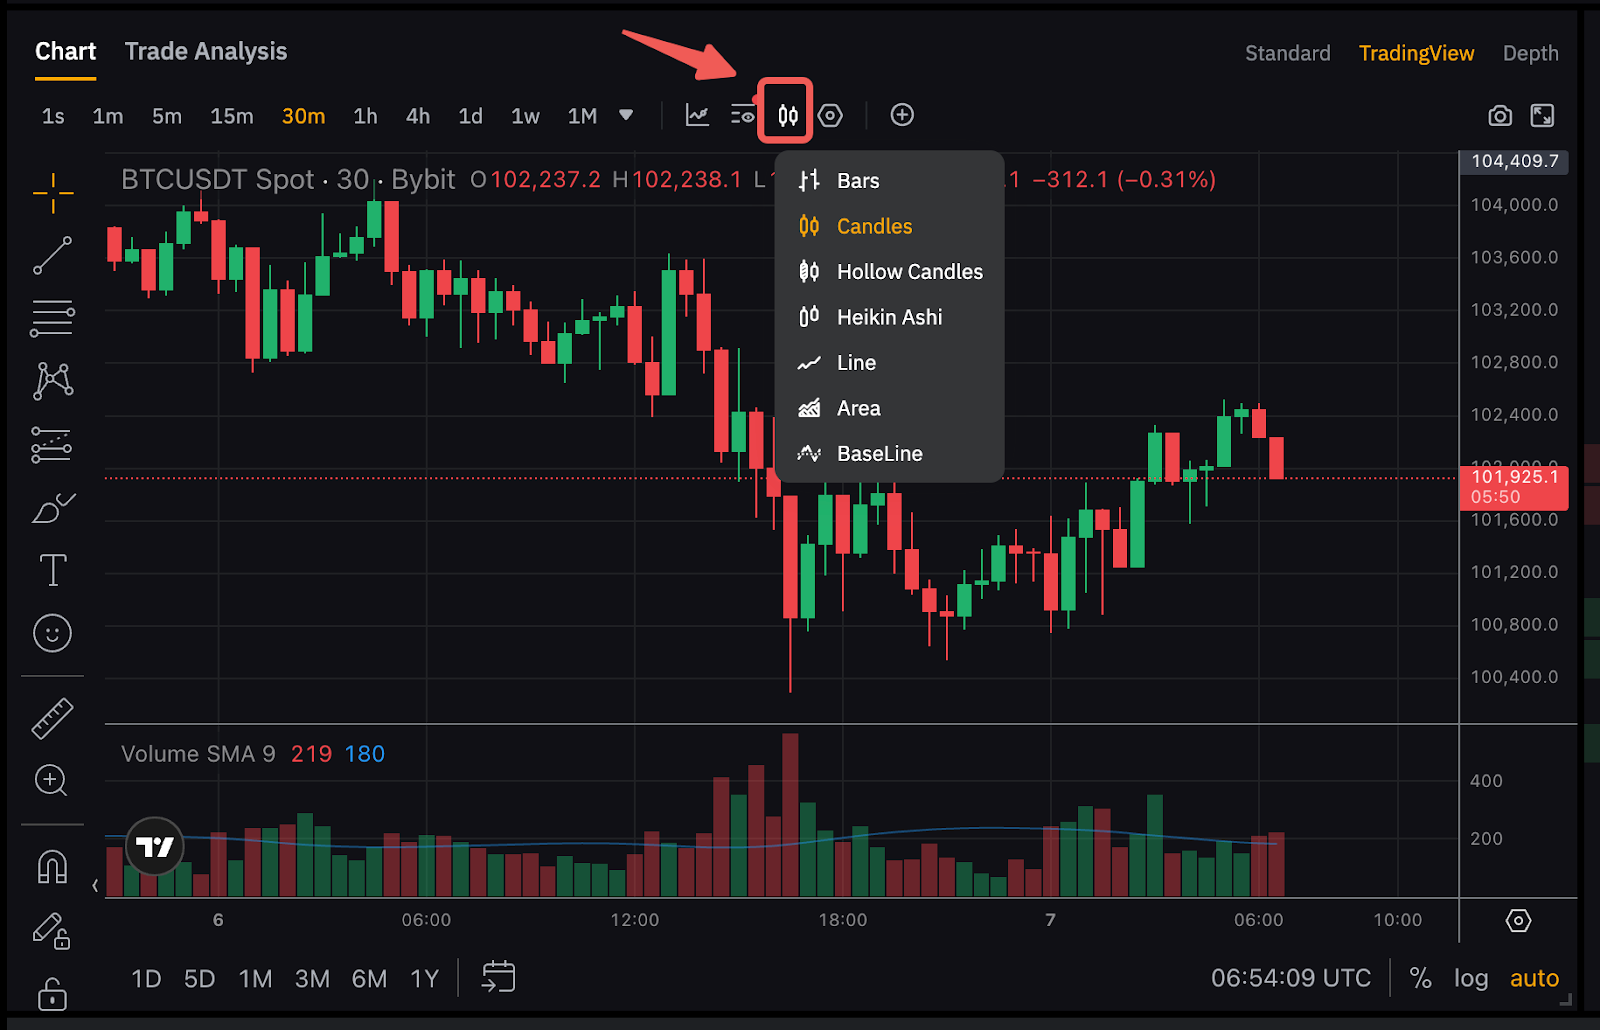
How can I switch between candlestick charts and line graph charts?
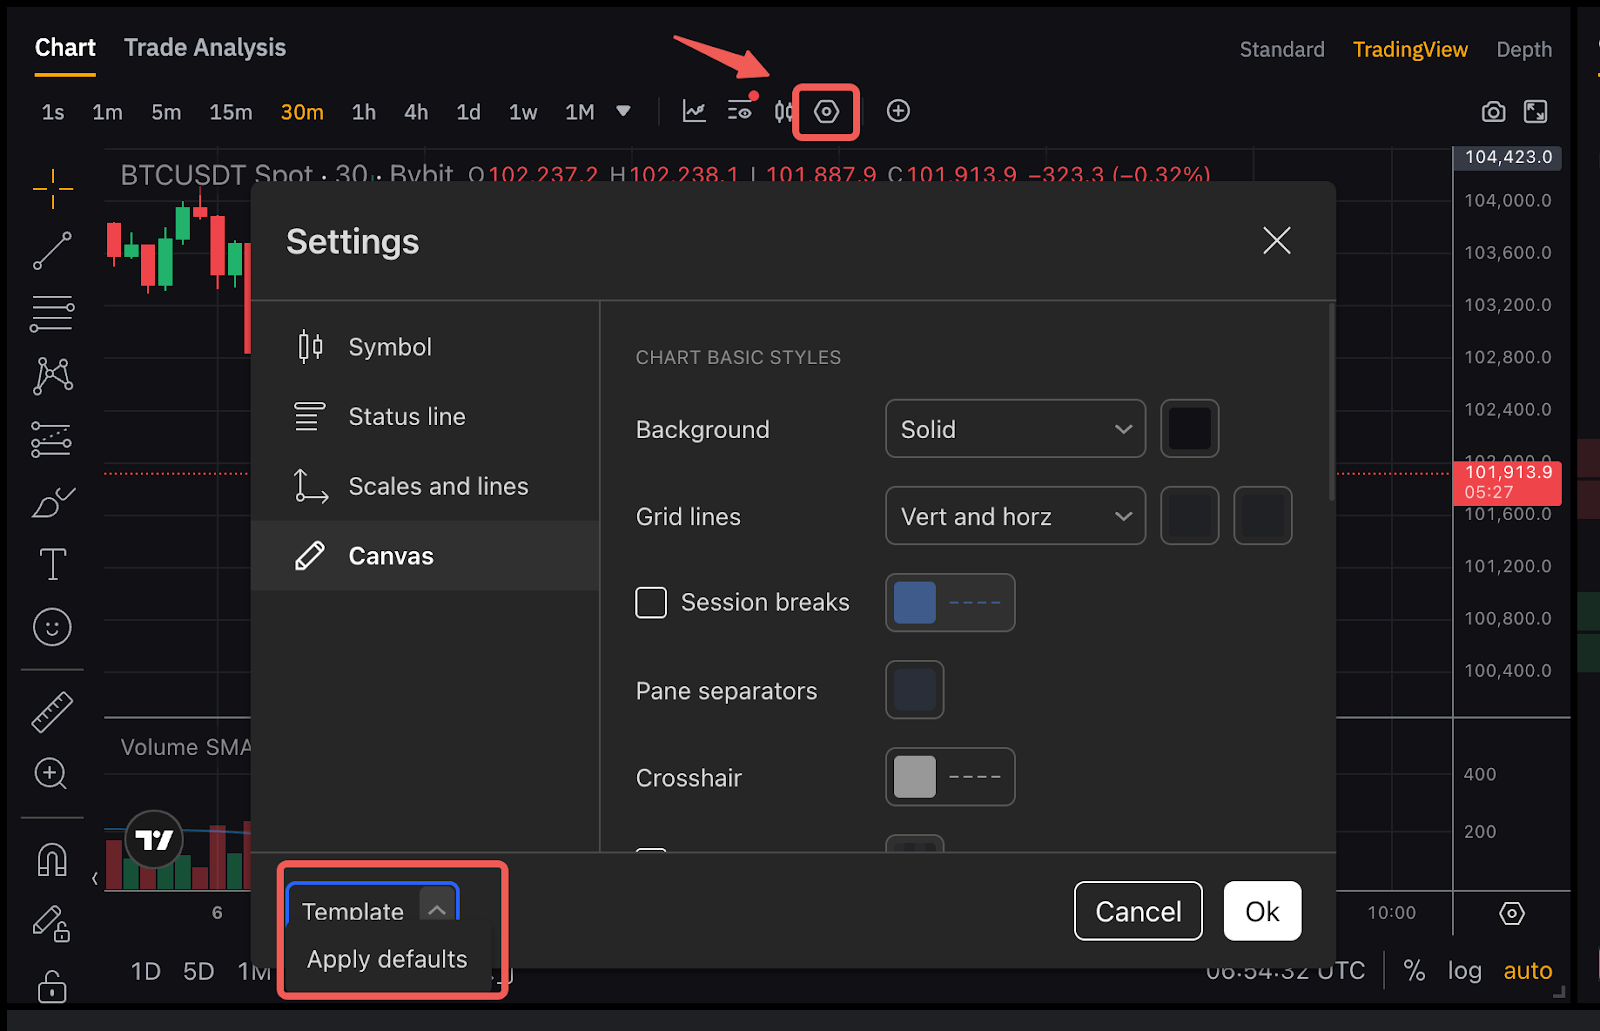
How do I reset the chart back to its default settings?
Right-click within the chart area, then click on Settings → Template → Apply Defaults. Alternatively, please clear your browser cookies and cache to reset the chart back to its default setting.
Will my chart drawings and indicators remain if I log in to my account using another PC device or browser?
Yes, they will remain if you use another PC device or browser. However, do note that the chart drawings and indicators will only be saved to the cloud every five (5) minutes, please allow some time to synchronize the data. Drawings on the PC chart will not be reflected on the Bybit TR App.
Is it possible to trade directly on TradingView?
No, traders can only view the Bybit TR trading charts inside TradingView at the moment. However, the Bybit TR team is always exploring possibilities to innovate and improve the Bybit TR User Experience.